Showing posts with label housing in san diego. Show all posts

Thursday, January 19, 2023

Today’s Housing Market Is Nothing Like 15 Years Ago

There’s no doubt today’s housing market is very different than the frenzied one from the past couple of years. In the second half of 2022, there was a dramatic shift in real estate, and it caused many people to make comparisons to the 2008 housing crisis. While there may be a few similarities, when looking at key variables now compared to the last housing cycle, there are significant differences.

In the latest Real Estate Forecast Summit, Lawrence Yun, Chief Economist at the National Association of Realtors (NAR), drew the comparisons below between today’s housing market and the previous cycle:


Looking at the facts, it’s clear: today is very different than the housing market of 15 years ago.

There’s Opportunity in Real Estate Today

And in today’s market, with inventory rising and less competition from other buyers, there’s opportunity right now. According to David Stevens, former Assistant Secretary of Housing:

“So be advised…this may be the one and only window for the next few years to get into a buyer’s market. And remember…as the Federal Reserve data shows…home prices only go up and always recover from recessions no matter how mild or severe. Long term homeowners should view this market…right now…as a unique buying opportunity.”

Bottom Line

Today’s housing market is nothing like the real estate market 15 years ago. If you’re a buyer right now, this may be the chance you’ve been waiting for.

Looking to Buy, Sell, or Invest? Contact:

David Demangos - eXp Realty
Cell: 858.232.8410 | Realtor® DRE# 01905183
www.AwesomeSanDiegoRealEstate.com
We Go to Extremes to Fulfill Real Estate Dreams!

San Diego Real Estate Expert | Global Property Specialist
Certified Luxury Marketing Specialist | CLHMS Million Dollar Guild Agent
Green Specialist | Certified International Property Specialist
2016, 2017, 2018,2019,2020,& 2021 Recognition of Excellence Award Winner SDAR

Saturday, November 5, 2022

3 Graphs Showing Why Today’s Housing Market Isn’t Like 2008

With all the headlines and talk in the media about the shift in the housing market, you might be thinking this is a housing bubble. It’s only natural for those thoughts to creep in that make you think it could be a repeat of what took place in 2008. But the good news is, there’s concrete data to show why this is nothing like the last time.

There’s Still a Shortage of Homes on the Market Today, Not a Surplus

For historical context, there were too many homes for sale during the housing crisis (many of which were short sales and foreclosures), and that caused prices to fall dramatically. Supply has increased since the start of this year, but there’s still a shortage of inventory available overall, primarily due to almost 15 years of underbuilding homes.

The graph below uses data from the National Association of Realtors (NAR) to show how the months’ supply of homes available now compares to the crash. Today, unsold inventory sits at just a 3.2-months’ supply at the current sales pace, which is significantly lower than the last time. There just isn’t enough inventory on the market for home prices to come crashing down like they did last time, even though some overheated markets may experience slight declines.


Mortgage Standards Were Much More Relaxed Back Then

During the lead-up to the housing crisis, it was much easier to get a home loan than it is today. Running up to 2006, banks were creating artificial demand by lowering lending standards and making it easy for just about anyone to qualify for a home loan or refinance their current home.

Back then, lending institutions took on much greater risk in both the person and the mortgage products offered. That led to mass defaults, foreclosures, and falling prices. Today, things are different, and purchasers face much higher standards from mortgage companies.

The graph below uses Mortgage Credit Availability Index (MCAI) data from the Mortgage Bankers Association (MBA) to help tell this story. In that index, the higher the number, the easier it is to get a mortgage. The lower the number, the harder it is. In the latest report, the index fell by 5.4%, indicating standards are tightening.


This graph also shows just how different things are today compared to the spike in credit availability leading up to the crash. Tighter lending standards over the past 14 years have helped prevent a scenario that would lead to a wave of foreclosures like the last time.

The Foreclosure Volume Is Nothing Like It Was During the Crash

Another difference is the number of homeowners that were facing foreclosure after the housing bubble burst. Foreclosure activity has been lower since the crash, largely because buyers today are more qualified and less likely to default on their loans. The graph below uses data from ATTOM Data Solutions to help paint the picture of how different things are this time:


Not to mention, homeowners today have options they just didn’t have in the housing crisis when so many people owed more on their mortgages than their homes were worth. Today, many homeowners are equity rich. That equity comes, in large part, from the way home prices have appreciated over time. According to CoreLogic:

“The total average equity per borrower has now reached almost $300,000, the highest in the data series.”

Rick Sharga, Executive VP of Market Intelligence at ATTOM Data, explains the impact this has:

“Very few of the properties entering the foreclosure process have reverted to the lender at the end of the foreclosure. . . . We believe that this may be an indication that borrowers are leveraging their equity and selling their homes rather than risking the loss of their equity in a foreclosure auction.”

This goes to show homeowners are in a completely different position this time. For those facing challenges today, many have the option to use their equity to sell their house and avoid the foreclosure process.

Bottom Line

If you’re concerned we’re making the same mistakes that led to the housing crash, the graphs above should help alleviate your fears. Concrete data and expert insights clearly show why this is nothing like the last time.

Looking to Buy, Sell, or Invest? Contact:

David Demangos - eXp Realty
Cell: 858.232.8410 | Realtor® DRE# 01905183
www.AwesomeSanDiegoRealEstate.com
We Go to Extremes to Fulfill Real Estate Dreams!

San Diego Real Estate Expert | Global Property Specialist
Certified Luxury Marketing Specialist | CLHMS Million Dollar Guild Agent
Green Specialist | Certified International Property Specialist
2016, 2017, 2018,2019,2020,& 2021 Recognition of Excellence Award Winner SDAR

Tuesday, September 14, 2021

5 Reasons Today’s Housing Market Is Anything but Normal

There are many headlines out there that claim we’re reverting to a more normal real estate market. That would indicate the housing market is returning to the pre-pandemic numbers we saw from 2015-2019. But that’s not happening. The market is still extremely vibrant as demand is still strong even while housing supply is slowly returning.

Here’s the definition of normal from the Merriam-Webster Dictionary:

“conforming to a type, standard, or regular pattern: characterized by that which is considered usual, typical, or routine.”

Using this definition, here are five housing industry metrics that prove we’re nowhere near normal.

1. Mortgage Rates


If we look at the 30-year mortgage rate chronicled by Freddie Mac, we can see the average rates by decade:
1970s: 8.86%
1980s: 12.7%
1990s: 8.12%
2000s: 6.29%
2010s: 4.09%

Today, the average mortgage rate stands at 2.87%, which is very close to the historic low.
Currently, mortgage rates are anything but usual, typical, or routine.

2. Home Price Appreciation

According to Black Knight, a housing data and analytics company, the average annual appreciation on residential real estate prices since 1995 has been 4.14%.

According to the latest forecast from the National Association of Realtors (NAR), home price appreciation will hit 14.1% this year, which will be greater than any year since Black Knight began collecting this data.

Currently, home price appreciation is anything but usual, typical, or routine.

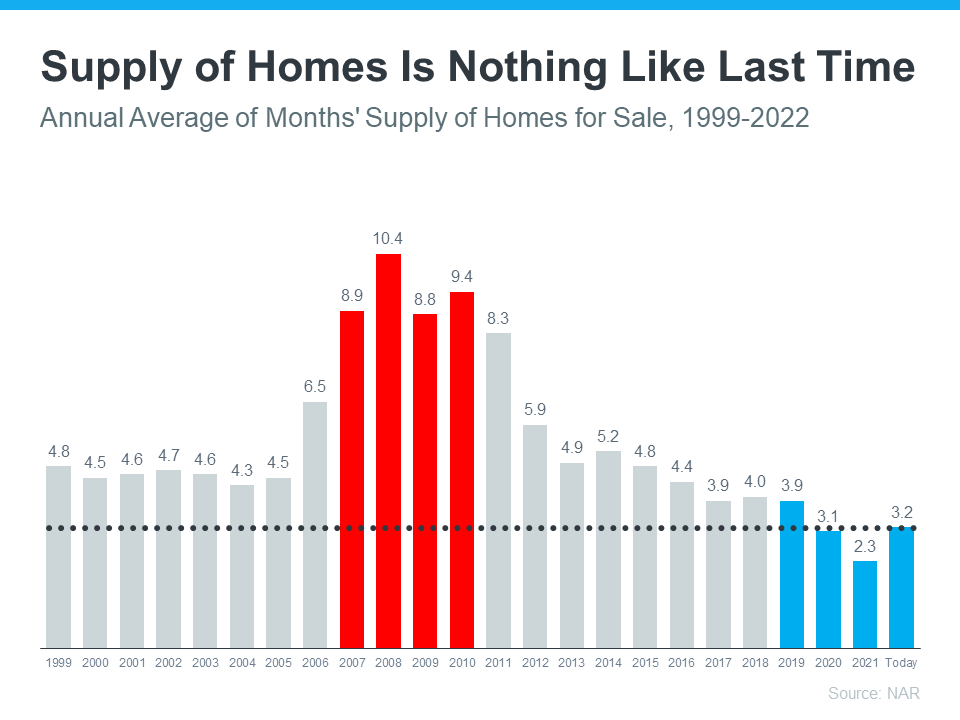
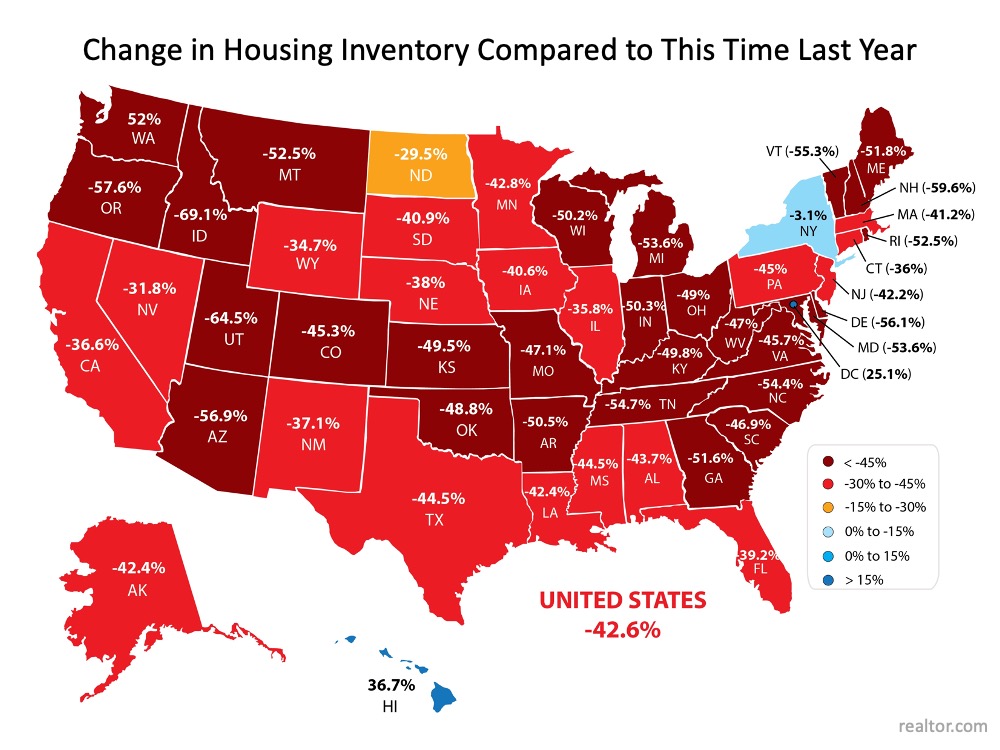
3. Months’ Supply of Inventory (Homes for Sale)

According to NAR:

“Months’ supply refers to the number of months it would take for the current inventory of homes on the market to sell given the current sales pace. Historically, six months of supply is associated with moderate price appreciation, and a lower level of months’ supply tends to push prices up more rapidly.”

As of the latest Existing Homes Sales Report from NAR, the current months’ supply of inventory stands at 2.6. That’s less than half of a normal supply.
Currently, the supply of homes for sale is anything but usual, typical, or routine.

4. Days It Takes To Sell a Home

The days-on-market metric gives an indication of how hot a market is and how quickly homes are selling. In 2019, prior to the pandemic, the average days on market stood at 35, according to NAR. Today, that number is cut in half and is now at 17 days.
Currently, the days-on-market metric is anything but usual, typical, or routine.

5. Number of Offers per Listing

According to NAR, the number of offers per listing stood at 2.2 in 2019. Today, that number is double at 4.5.

Currently, the number of offers per listing is anything but usual, typical, or routine.

Bottom Line

When…
Mortgage rates are near historic lows
Price appreciation is at historic highs
Housing inventory is less than half of the normal amount
The time it takes to sell a home is cut in half, and
There are twice as many offers on each house

…it’s hard to say we’re in a normal market.

Looking to Buy, Sell, or Invest? Contact:

David Demangos - eXp Realty
Cell: 858.232.8410 | Realtor® DRE# 01905183
www.AwesomeSanDiegoRealEstate.com
We Go to Extremes to Fulfill Real Estate Dreams!

San Diego Real Estate Expert | Global Property Specialist
Certified Luxury Marketing Specialist | CLHMS Million Dollar Guild Agent
Green Specialist | Certified International Property Specialist
2016, 2017, 2018,& 2019 Recognition of Excellence Award Winner SDAR

Sunday, March 7, 2021

Where Have All the Houses Gone?

In today’s housing market, it seems harder than ever to find a home to buy. Before the health crisis hit us a year ago, there was already a shortage of homes for sale. When many homeowners delayed their plans to sell at the same time that more buyers aimed to take advantage of record-low mortgage rates and purchase a home, housing inventory dropped even further. Experts consider this to be the biggest challenge facing an otherwise hot market while buyers continue to compete for homes. As Danielle Hale, Chief Economist at realtor.com, explains:

“With buyers active in the market and seller participation lagging, homes are selling quickly and the total number available for sale at any point in time continues to drop lower. In January as a whole, the number of for sale homes dropped below 600,000.”

Every month, realtor.com releases new data showing the year-over-year change in inventory of existing homes for sale. As you can see in the map below, nationwide, inventory is 42.6% lower than it was at this time last year:


Does this mean houses aren’t being put on the market for sale?

Not exactly. While there are fewer existing homes being listed right now, many homes are simply selling faster than they’re being counted as current inventory. The market is that competitive! It’s like when everyone was trying to find toilet paper to buy last spring and it was flying off the shelves faster than it could be stocked in the stores. That’s what’s happening in the housing market: homes are being listed for sale, but not at a rate that can keep up with heavy demand from competitive buyers.

In the same realtor.com report, Hale explains:

“Time on the market was 10 days faster than last year meaning that buyers still have to make decisions quickly in order to be successful. Today’s buyers have many tools to help them do that, including the ability to be notified as soon as homes meeting their search criteria hit the market. By tailoring search and notifications to the homes that are a solid match, buyers can act quickly and compete successfully in this faster-paced housing market.”
The Good News for Homeowners

The health crisis has been a major reason why potential sellers have held off this long, but as vaccines become more widely available, homeowners will start making their moves. Ali Wolf, Chief Economist at Zonda, confirms:

“Some people will feel comfortable listing their home during the first half of 2021. Others will want to wait until the vaccines are widely distributed.”

With more homeowners getting ready to sell later this year, putting your house on the market sooner rather than later is the best way to make sure your listing shines brighter than the rest.

When you’re ready to sell your house, you’ll likely want it to sell as quickly as possible, for the best price, and with little to no hassle. If you’re looking for these selling conditions, you’ll find them in today’s market. When demand is high and inventory is low, sellers have the ability to create optimal terms and timelines for the sale, making now an exceptional time to move.

Bottom Line

Today’s housing market is a big win for sellers, but these conditions won’t last forever. If you’re in a position to sell your house now, you may not want to wait for your neighbors to do the same. Let’s connect to discuss how to sell your house safely so you’re able to benefit from today’s high demand and low inventory.

Looking to Buy, Sell, or Invest? Contact:

David Demangos - eXp Realty
Cell: 858.232.8410 | Realtor® DRE# 01905183
www.AwesomeSanDiegoRealEstate.com
We Go to Extremes to Fulfill Real Estate Dreams!

San Diego Real Estate Expert | Global Property Specialist
Certified Luxury Marketing Specialist | CLHMS Million Dollar Guild Agent
Green Specialist | Certified International Property Specialist
2016, 2017, 2018,& 2019 Recognition of Excellence Award Winner SDAR

Thursday, February 25, 2021

3 Reasons We’re Definitely Not in a Housing Bubble

Home values appreciated by about ten percent in 2020, and they’re forecast to appreciate by about five percent this year. This has some voicing concern that we may be in another housing bubble like the one we experienced a little over a decade ago. Here are three reasons why this market is totally different.

1. This time, housing supply is extremely limited

The price of any market item is determined by supply and demand. If supply is high and demand is low, prices normally decrease. If supply is low and demand is high, prices naturally increase.

In real estate, supply and demand are measured in “months’ supply of inventory,” which is based on the number of current homes for sale compared to the number of buyers in the market. The normal months’ supply of inventory for the market is about 6 months. Anything above that defines a buyers’ market, indicating prices will soften. Anything below that defines a sellers’ market in which prices normally appreciate.

Between 2006 and 2008, the months’ supply of inventory increased from just over 5 months to 11 months. The months’ supply was over 7 months in twenty-seven of those thirty-six months, yet home values continued to rise.

Months’ inventory has been under 5 months for the last 3 years, under 4 for thirteen of the last fourteen months, under 3 for the last six months, and currently stands at 1.9 months – a historic low.

Remember, if supply is low and demand is high, prices naturally increase.

2. This time, housing demand is real

During the housing boom in the mid-2000s, there was what Robert Schiller, a fellow at the Yale School of Management’s International Center for Finance, called “irrational exuberance.” The definition of the term is, “unfounded market optimism that lacks a real foundation of fundamental valuation, but instead rests on psychological factors.” Without considering historic market trends, people got caught up in the frenzy and bought houses based on an unrealistic belief that housing values would continue to escalate.

The mortgage industry fed into this craziness by making mortgage money available to just about anyone, as shown in the Mortgage Credit Availability Index (MCAI) published by the Mortgage Bankers Association. The higher the index, the easier it is to get a mortgage; the lower the index, the more difficult it is to obtain one. Prior to the housing boom, the index stood just below 400. In 2006, the index hit an all-time high of over 868. Again, just about anyone could get a mortgage. Today, the index stands at 122.5, which is well below even the pre-boom level.

In the current real estate market, demand is real, not fabricated. Millennials, the largest generation in the country, have come of age to marry and have children, which are two major drivers for homeownership. The health crisis is also challenging every household to redefine the meaning of “home” and to re-evaluate whether their current home meets that new definition. This desire to own, coupled with historically low mortgage rates, makes purchasing a home today a strong, sound financial decision. Therefore, today’s demand is very real.

Remember, if supply is low and demand is high, prices naturally increase.

3. This time, households have plenty of equity

Again, during the housing boom, it wasn’t just purchasers who got caught up in the frenzy. Existing homeowners started using their homes like ATM machines. There was a wave of cash-out refinances, which enabled homeowners to leverage the equity in their homes. From 2005 through 2007, Americans pulled out $824 billion dollars in equity. That left many homeowners with little or no equity in their homes at a critical time. As prices began to drop, some homeowners found themselves in a negative equity situation where the mortgage was higher than the value of their home. Many defaulted on their payments, which led to an avalanche of foreclosures.

Today, the banks and the American people have shown they learned a valuable lesson from the housing crisis a little over a decade ago. Cash-out refinance volume over the last three years was less than a third of what it was compared to the 3 years leading up to the crash.

This conservative approach has created levels of equity never seen before. According to Census Bureau data, over 38% of owner-occupied housing units are owned ‘free and clear’ (without any mortgage). Also, ATTOM Data Solutions just released their fourth quarter 2020 U.S. Home Equity Report, which revealed:

“17.8 million residential properties in the United States were considered equity-rich, meaning that the combined estimated amount of loans secured by those properties was 50 percent or less of their estimated market value…The count of equity-rich properties in the fourth quarter of 2020 represented 30.2 percent, or about one in three, of the 59 million mortgaged homes in the United States.”

If we combine the 38% of homes that are owned free and clear with the 18.7% of all homes that have at least 50% equity (30.2% of the remaining 62% with a mortgage), we realize that 56.7% of all homes in this country have a minimum of 50% equity. That’s significantly better than the equity situation in 2008.

Bottom Line

This time, housing supply is at a historic low. Demand is real and rightly motivated. Even if there were to be a drop in prices, homeowners have enough equity to be able to weather a dip in home values. This is nothing like 2008. In fact, it’s the exact opposite.

Looking to Buy, Sell, or Invest? Contact:

David Demangos - eXp Realty
Cell: 858.232.8410 | Realtor® DRE# 01905183
www.AwesomeSanDiegoRealEstate.com
We Go to Extremes to Fulfill Real Estate Dreams!

San Diego Real Estate Expert | Global Property Specialist
Certified Luxury Marketing Specialist | CLHMS Million Dollar Guild Agent
Green Specialist | Certified International Property Specialist
2016, 2017, 2018,& 2019 Recognition of Excellence Award Winner SDAR