Showing posts with label housing bubble. Show all posts

Saturday, September 24, 2022

Is the Real Estate Market Slowing Down, or Is This a Housing Bubble?

The talk of a housing bubble in the coming year seems to be at a fever pitch as rising mortgage rates continue to slow down an overheated real estate market. Over the past two years, home prices have appreciated at an unsustainable pace causing many to ask: are things just slowing down, or is a crash coming?

To answer this question, there are two things we want to understand. The first is the reality of the shift in today’s housing market. And the second is what experts are saying about home prices in the coming year.

The Reality of the Shift in Today’s Housing Market

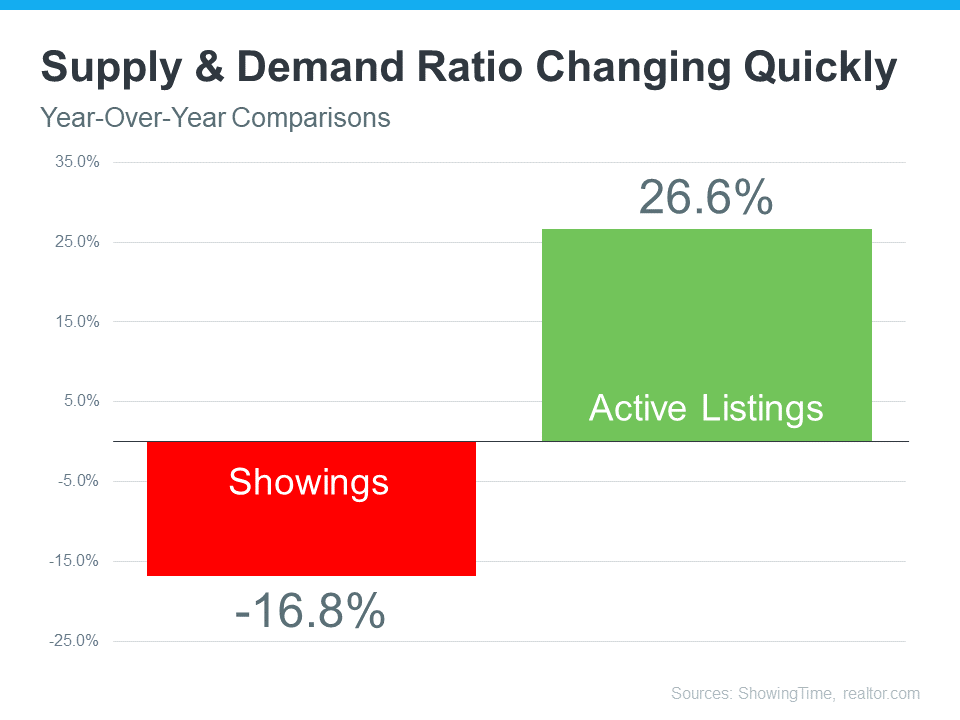
The reality is we’re seeing an inflection point in housing supply and demand. According to realtor.com, active listings have increased more than 26% over last year, while showings from the latest ShowingTime Showing Index have decreased almost 17% from last year (see graph below). This is an inflection point for housing because, over the past two years, we’ve seen a massive amount of demand (showings) and not enough homes available for sale for the number of people that wanted to buy. That caused the market frenzy.

Today, supply and demand look very different, and the market is slowing down from the pace we’ve seen. This offers proof of the sudden slowdown so many people are feeling.


What Experts Are Saying About Home Prices in the Coming Year

Right now, most experts are forecasting home price appreciation in 2023, but at a much slower pace than the last two years. The average of the six forecasters below is for national home prices to appreciate by 2.5% in the coming year. Only one of the six is calling for home price depreciation.


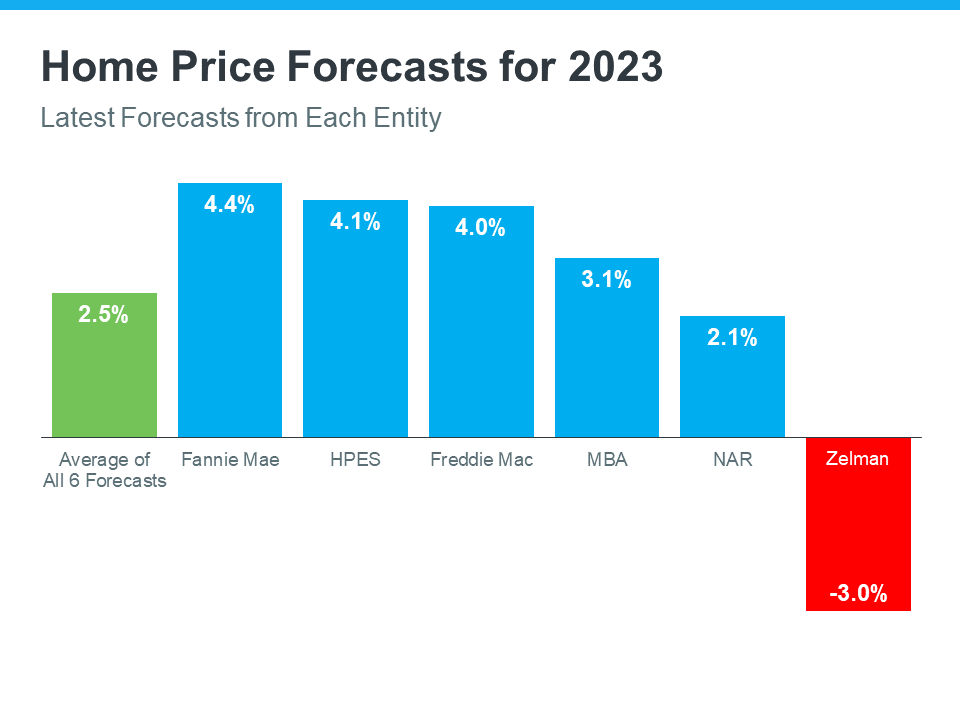
When we look at the shift taking place along with what experts are saying, we can conclude the national real estate market is slowing down but is not a bubble getting ready to burst. This isn’t to say that a few overheated markets won’t experience home price depreciation, but there isn’t a case to be made for a national housing bubble.

Bottom Line

The real estate market is slowing down, and that’s causing many to fear we’re in a housing bubble. What we’ve experienced in the housing market over the past two years were historic levels of demand and constrained supply. That led to homes going up in value at a record pace. While some overheated markets may experience price depreciation in the short term, according to experts, the national real estate market will appreciate in the coming year.

Looking to Buy, Sell, or Invest? Contact:

David Demangos - eXp Realty
Cell: 858.232.8410 | Realtor® DRE# 01905183
www.AwesomeSanDiegoRealEstate.com
We Go to Extremes to Fulfill Real Estate Dreams!

San Diego Real Estate Expert | Global Property Specialist
Certified Luxury Marketing Specialist | CLHMS Million Dollar Guild Agent
Green Specialist | Certified International Property Specialist
2016, 2017, 2018,2019,2020,& 2021 Recognition of Excellence Award Winner SDAR

Tuesday, August 9, 2022

3 Graphs To Show This Isn’t a Housing Bubble

With all the headlines and buzz in the media, some consumers believe the market is in a housing bubble. As the housing market shifts, you may be wondering what’ll happen next. It’s only natural for concerns to creep in that it could be a repeat of what took place in 2008. The good news is, there’s concrete data to show why this is nothing like the last time.

There’s a Shortage of Homes on the Market Today, Not a Surplus

The supply of inventory needed to sustain a normal real estate market is approximately six months. Anything more than that is an overabundance and will causes prices to depreciate. Anything less than that is a shortage and will lead to continued price appreciation.

For historical context, there were too many homes for sale during the housing crisis (many of which were short sales and foreclosures), and that caused prices to tumble. Today, supply is growing, but there’s still a shortage of inventory available.

The graph below uses data from the National Association of Realtors (NAR) to show how this time compares to the crash. Today, unsold inventory sits at just a 3.0-months’ supply at the current sales pace.


One of the reasons inventory is still low is because of sustained underbuilding. When you couple that with ongoing buyer demand as millennials age into their peak homebuying years, it continues to put upward pressure on home prices. That limited supply compared to buyer demand is why experts forecast home prices won’t fall this time.

Mortgage Standards Were Much More Relaxed During the Crash

During the lead-up to the housing crisis, it was much easier to get a home loan than it is today. The graph below showcases data on the Mortgage Credit Availability Index (MCAI) from the Mortgage Bankers Association (MBA). The higher the number, the easier it is to get a mortgage.


Running up to 2006, banks were creating artificial demand by lowering lending standards and making it easy for just about anyone to qualify for a home loan or refinance their current home. Back then, lending institutions took on much greater risk in both the person and the mortgage products offered. That led to mass defaults, foreclosures, and falling prices.

Today, things are different, and purchasers face much higher standards from mortgage companies. Mark Fleming, Chief Economist at First American, says:

“Credit standards tightened in recent months due to increasing economic uncertainty and monetary policy tightening.”

Stricter standards, like there are today, help prevent a risk of a rash of foreclosures like there was last time.

The Foreclosure Volume Is Nothing Like It Was During the Crash

The most obvious difference is the number of homeowners that were facing foreclosure after the housing bubble burst. Foreclosure activity has been on the way down since the crash because buyers today are more qualified and less likely to default on their loans. The graph below uses data from ATTOM Data Solutions to help tell the story:


In addition, homeowners today are equity rich, not tapped out. In the run-up to the housing bubble, some homeowners were using their homes as personal ATMs. Many immediately withdrew their equity once it built up. When home values began to fall, some homeowners found themselves in a negative equity situation where the amount they owed on their mortgage was greater than the value of their home. Some of those households decided to walk away from their homes, and that led to a wave of distressed property listings (foreclosures and short sales), which sold at considerable discounts that lowered the value of other homes in the area.

Today, prices have risen nicely over the last few years, and that’s given homeowners an equity boost. According to Black Knight:

“In total, mortgage holders gained $2.8 trillion in tappable equity over the past 12 months – a 34% increase that equates to more than $207,000 in equity available per borrower. . . .”

With the average home equity now standing at $207,000, homeowners are in a completely different position this time.

Bottom Line

If you’re worried we’re making the same mistakes that led to the housing crash, the graphs above should help alleviate your concerns. Concrete data and expert insights clearly show why this is nothing like the last time.

Looking to Buy, Sell, or Invest? Contact:

David Demangos - eXp Realty
Cell: 858.232.8410 | Realtor® DRE# 01905183
www.AwesomeSanDiegoRealEstate.com
We Go to Extremes to Fulfill Real Estate Dreams!

San Diego Real Estate Expert | Global Property Specialist
Certified Luxury Marketing Specialist | CLHMS Million Dollar Guild Agent
Green Specialist | Certified International Property Specialist
2016, 2017, 2018,2019,2020,& 2021 Recognition of Excellence Award Winner SDAR

Sunday, July 18, 2021

3 Charts That Show This Isn’t a Housing Bubble

With home prices continuing to deliver double-digit increases, some are concerned we’re in a housing bubble like the one in 2006. However, a closer look at the market data indicates this is nothing like 2006 for three major reasons.

1. The housing market isn’t driven by risky mortgage loans.

Back in 2006, nearly everyone could qualify for a loan. The Mortgage Credit Availability Index (MCAI) from the Mortgage Bankers’ Association is an indicator of the availability of mortgage money. The higher the index, the easier it is to obtain a mortgage. The MCAI more than doubled from 2004 (378) to 2006 (869). Today, the index stands at 130. As an example of the difference between today and 2006, let’s look at the volume of mortgages that originated when a buyer had less than a 620 credit score.


Dr. Frank Nothaft, Chief Economist for CoreLogic, reiterates this point:

“There are marked differences in today’s run up in prices compared to 2005, which was a bubble fueled by risky loans and lenient underwriting. Today, loans with high-risk features are absent and mortgage underwriting is prudent.”

2. Homeowners aren’t using their homes as ATMs this time.

During the housing bubble, as prices skyrocketed, people were refinancing their homes and pulling out large sums of cash. As prices began to fall, that caused many to spiral into a negative equity situation (where their mortgage was higher than the value of the house).

Today, homeowners are letting their equity build. Tappable equity is the amount available for homeowners to access before hitting a maximum 80% combined loan-to-value ratio (thus still leaving them with at least 20% equity). In 2006, that number was $4.6 billion. Today, that number stands at over $8 billion.

Yet, the percentage of cash-out refinances (where the homeowner takes out at least 5% more than their original mortgage amount) is half of what it was in 2006.


3. This time, it’s simply a matter of supply and demand.

FOMO (the Fear Of Missing Out) dominated the housing market leading up to the 2006 housing bubble and drove up buyer demand. Back then, housing supply more than kept up as many homeowners put their houses on the market, as evidenced by the over seven months’ supply of existing housing inventory available for sale in 2006. Today, that number is barely two months.

Builders also overbuilt during the bubble but pulled back significantly over the next decade. Sam Khater, VP and Chief Economist, Economic & Housing Research at Freddie Mac, explains that pullback is the major factor in the lack of available inventory today:

“The main driver of the housing shortfall has been the long-term decline in the construction of single-family homes.”

Here’s a chart that quantifies Khater’s remarks:


Today, there are simply not enough homes to keep up with current demand.

Bottom Line

This market is nothing like the run-up to 2006. Bill McBride, the author of the prestigious Calculated Risk blog, predicted the last housing bubble and crash. This is what he has to say about today’s housing market:

“It’s not clear at all to me that things are going to slow down significantly in the near future. In 2005, I had a strong sense that the hot market would turn and that, when it turned, things would get very ugly. Today, I don’t have that sense at all, because all of the fundamentals are there. Demand will be high for a while because Millennials need houses. Prices will keep rising for a while because inventory is so low.”

Looking to Buy, Sell, or Invest? Contact:

David Demangos - eXp Realty
Cell: 858.232.8410 | Realtor® DRE# 01905183
www.AwesomeSanDiegoRealEstate.com
We Go to Extremes to Fulfill Real Estate Dreams!

San Diego Real Estate Expert | Global Property Specialist
Certified Luxury Marketing Specialist | CLHMS Million Dollar Guild Agent
Green Specialist | Certified International Property Specialist
2016, 2017, 2018,& 2019 Recognition of Excellence Award Winner SDAR

Thursday, February 25, 2021

3 Reasons We’re Definitely Not in a Housing Bubble

Home values appreciated by about ten percent in 2020, and they’re forecast to appreciate by about five percent this year. This has some voicing concern that we may be in another housing bubble like the one we experienced a little over a decade ago. Here are three reasons why this market is totally different.

1. This time, housing supply is extremely limited

The price of any market item is determined by supply and demand. If supply is high and demand is low, prices normally decrease. If supply is low and demand is high, prices naturally increase.

In real estate, supply and demand are measured in “months’ supply of inventory,” which is based on the number of current homes for sale compared to the number of buyers in the market. The normal months’ supply of inventory for the market is about 6 months. Anything above that defines a buyers’ market, indicating prices will soften. Anything below that defines a sellers’ market in which prices normally appreciate.

Between 2006 and 2008, the months’ supply of inventory increased from just over 5 months to 11 months. The months’ supply was over 7 months in twenty-seven of those thirty-six months, yet home values continued to rise.

Months’ inventory has been under 5 months for the last 3 years, under 4 for thirteen of the last fourteen months, under 3 for the last six months, and currently stands at 1.9 months – a historic low.

Remember, if supply is low and demand is high, prices naturally increase.

2. This time, housing demand is real

During the housing boom in the mid-2000s, there was what Robert Schiller, a fellow at the Yale School of Management’s International Center for Finance, called “irrational exuberance.” The definition of the term is, “unfounded market optimism that lacks a real foundation of fundamental valuation, but instead rests on psychological factors.” Without considering historic market trends, people got caught up in the frenzy and bought houses based on an unrealistic belief that housing values would continue to escalate.

The mortgage industry fed into this craziness by making mortgage money available to just about anyone, as shown in the Mortgage Credit Availability Index (MCAI) published by the Mortgage Bankers Association. The higher the index, the easier it is to get a mortgage; the lower the index, the more difficult it is to obtain one. Prior to the housing boom, the index stood just below 400. In 2006, the index hit an all-time high of over 868. Again, just about anyone could get a mortgage. Today, the index stands at 122.5, which is well below even the pre-boom level.

In the current real estate market, demand is real, not fabricated. Millennials, the largest generation in the country, have come of age to marry and have children, which are two major drivers for homeownership. The health crisis is also challenging every household to redefine the meaning of “home” and to re-evaluate whether their current home meets that new definition. This desire to own, coupled with historically low mortgage rates, makes purchasing a home today a strong, sound financial decision. Therefore, today’s demand is very real.

Remember, if supply is low and demand is high, prices naturally increase.

3. This time, households have plenty of equity

Again, during the housing boom, it wasn’t just purchasers who got caught up in the frenzy. Existing homeowners started using their homes like ATM machines. There was a wave of cash-out refinances, which enabled homeowners to leverage the equity in their homes. From 2005 through 2007, Americans pulled out $824 billion dollars in equity. That left many homeowners with little or no equity in their homes at a critical time. As prices began to drop, some homeowners found themselves in a negative equity situation where the mortgage was higher than the value of their home. Many defaulted on their payments, which led to an avalanche of foreclosures.

Today, the banks and the American people have shown they learned a valuable lesson from the housing crisis a little over a decade ago. Cash-out refinance volume over the last three years was less than a third of what it was compared to the 3 years leading up to the crash.

This conservative approach has created levels of equity never seen before. According to Census Bureau data, over 38% of owner-occupied housing units are owned ‘free and clear’ (without any mortgage). Also, ATTOM Data Solutions just released their fourth quarter 2020 U.S. Home Equity Report, which revealed:

“17.8 million residential properties in the United States were considered equity-rich, meaning that the combined estimated amount of loans secured by those properties was 50 percent or less of their estimated market value…The count of equity-rich properties in the fourth quarter of 2020 represented 30.2 percent, or about one in three, of the 59 million mortgaged homes in the United States.”

If we combine the 38% of homes that are owned free and clear with the 18.7% of all homes that have at least 50% equity (30.2% of the remaining 62% with a mortgage), we realize that 56.7% of all homes in this country have a minimum of 50% equity. That’s significantly better than the equity situation in 2008.

Bottom Line

This time, housing supply is at a historic low. Demand is real and rightly motivated. Even if there were to be a drop in prices, homeowners have enough equity to be able to weather a dip in home values. This is nothing like 2008. In fact, it’s the exact opposite.

Looking to Buy, Sell, or Invest? Contact:

David Demangos - eXp Realty
Cell: 858.232.8410 | Realtor® DRE# 01905183
www.AwesomeSanDiegoRealEstate.com
We Go to Extremes to Fulfill Real Estate Dreams!

San Diego Real Estate Expert | Global Property Specialist
Certified Luxury Marketing Specialist | CLHMS Million Dollar Guild Agent
Green Specialist | Certified International Property Specialist
2016, 2017, 2018,& 2019 Recognition of Excellence Award Winner SDAR

Saturday, March 10, 2018

A New Housing Bubble Forming…Not Before 2024!

A recent report by CoreLogic revealed that U.S. home values appreciated by more than 37% over the last five years. Some are concerned that this is evidence we may be on the verge of another housing “boom and bust” like the one we experienced from 2006-2008.

Recently, several housing experts weighed in on the subject to alleviate these fears.
Sean Becketti, Freddie Mac Chief Economist

“The evidence indicates there currently is no house price bubble in the U.S., despite the rapid increase of house prices over the last five years.”

Edward Golding, a Senior Fellow at the Urban Institute’s Housing Finance Policy Center

“There is not likely to be a national bubble in the way that we saw the first decade of the century.”
Christopher Thornberg, Partner at Beacon Economics

“There is no direct or indirect sign of any kind of bubble.”
Bill McBride, Calculated Risk

“I wouldn’t call house prices a bubble.”
David M. Blitzer, Chairman of the Index Committee at S&P Dow Jones Indices
“Housing is not repeating the bubble period of 2000-2006.”

A recent article by Teo Nicolais, a real estate entrepreneur who teaches courses on real estate principles, markets, and finance at Harvard Extension School concluded that the next housing bubble may not occur until 2024.

The article, How to Use Real Estate Trends to Predict the Next Housing Bubble, looks at previous peaks in real estate values going all the way back to 1818. Nicolais uses the research of several economists. The article details the four phases of a real estate cycle and what defines each phase.

Nicolais concluded his article by saying:

“Those who study the financial crisis of 2008 will (we hope) always be weary of the next major crash. If George, Harrison, and Foldvary are right, however, that won’t happen until after the next peak around 2024.

Between now and then, aside from the occasional slow down and inevitable market hiccups, the real estate industry is likely to enjoy a long period of expansion.”

Bottom Line

The reason for the price appreciation we are seeing is an imbalance between supply and demand for housing. This has created a natural increase in values, not a bubble in prices.

Looking to Buy, Sell, or Invest? Contact:

David Demangos - Keller Williams Realty
Cell: 858.232.8410 | Realtor® BRE# 01905183
www.AwesomeSanDiegoRealEstate.com
Our Team Goes to Extremes to Fulfill Your Real Estate Dreams!

San Diego Real Estate Expert | Global Property Specialist
Certified Luxury Marketing Specialist | CLHMS Million Dollar Guild Agent
Green Specialist | Certified International Property Specialist
2016 & 2017 Recognition of Excellence Award Winner SDAR

Sunday, December 10, 2017

Bubble Alert! Is it Getting Too Easy to Get a Mortgage?

There is little doubt that it is easier to get a home mortgage today than it was last year. The Mortgage Credit Availability Index (MCAI), published by the Mortgage Bankers Association, shows that mortgage credit has become more available in each of the last several years. In fact, in just the last year:

More buyers are putting less than 20% down to purchase a home

The average credit score on closed mortgages is lower

More low-down-payment programs have been introduced

This has some people worrying that we are returning to the lax lending standards which led to the boom and bust that real estate experienced ten years ago. Let’s alleviate some of that concern.

The graph below shows the MCAI going back to the boom years of 2004-2005. The higher the graph line, the easier it was to get a mortgage.


As you can see, lending standards were much more lenient from 2004 to 2007. Though it has gradually become easier to get a mortgage since 2011, we are nowhere near the lenient standards during the boom.

The Urban Institute also publishes a Home Credit Availability Index (HCAI). According to the Institute, the HCAI:

“Measures the percentage of home purchase loans that are likely to default—that is, go unpaid for more than 90 days past their due date. A lower HCAI indicates that lenders are unwilling to tolerate defaults and are imposing tighter lending standards, making it harder to get a loan. A higher HCAI indicates … it is easier to get a loan.”

Here is a graph showing their findings:


Again, today’s lending standards are nowhere near the levels of the boom years. As a matter of fact, they are more stringent than they were even before the boom.


Bottom Line

It is getting easier to gain financing for a home purchase. However, we are not seeing the irresponsible lending that caused the housing crisis.

Looking to Buy, Sell, or Invest? Contact:

David Demangos - Keller Williams Realty
Cell: 858.232.8410 | Realtor® BRE# 01905183
www.AwesomeSanDiegoRealEstate.com
Our Team Goes to Extremes to Fulfill Your Real Estate Dreams!

San Diego Real Estate Expert | Global Property Specialist
Certified Luxury Marketing Specialist | CLHMS Million Dollar Guild Agent
Green Specialist | Certified International Property Specialist
2016 Recognition of Excellence Award Winner SDAR

Sunday, May 28, 2017

3 Reasons the Housing Market is NOT in a Bubble

With housing prices appreciating at levels that far exceed historical norms, some are fearful that the market is heading for another bubble. To alleviate that fear, we just need to look back at the reasons that caused the bubble ten years ago.

Last decade, demand for housing was artificially propped up because mortgage lending standards were way too lenient. People that were not qualified to purchase were able to attain a mortgage anyway. Prices began to skyrocket. This increase in demand caused homebuilders in many markets to overbuild.

Eventually, the excess in new construction and the flooding of the market with distressed properties (foreclosures & short sales), caused by the lack of appropriate lending standards, led to the housing crash.


Where we are today…
1. If we look at lending standards based on the Mortgage Credit Availability Index released monthly by the Mortgage Bankers Association, we can see that, though standards have become more reasonable over the last few years, they are nowhere near where they were in the early 2000s.


2. If we look at new construction, we can see that builders are not “over building.” Average annual housing starts in the first quarter of this year were not just below numbers recorded in 2002-2006, they are below starts going all the way back to 1980.


3. If we look at home prices, most homes haven’t even returned to prices seen a decade ago. Trulia just released a report that explained:

“When it comes to the value of individual homes, the U.S. housing market has yet to recover. In fact, just 34.2% of homes nationally have seen their value surpass their pre-recession peak.”


Bottom Line


Mortgage lending standards are appropriate, new construction is below what is necessary and home prices haven’t even recovered. It appears fears of a housing bubble are over-exaggerated.

Looking to Buy, Sell, or Invest? Contact:

David Demangos - Keller Williams Realty
Cell: 858.232.8410 | Realtor® BRE# 01905183
www.AwesomeSanDiegoRealEstate.com
Our Team Goes to Extremes to Fulfill Your Real Estate Dreams!

San Diego Real Estate Expert | Global Property Specialist
Certified Luxury Marketing Specialist | CLHMS Million Dollar Guild Agent
Green Specialist | Certified International Property Specialist
2016 Recognition of Excellence Award Winner SDAR

Saturday, April 9, 2016

Further Proof This Isn’t a Housing Bubble

Further Proof This Isn’t a Housing Bubble | Keeping Current MattersTwo weeks ago, we posted a blog which explained that current increases in home prices were the result of the well-known concept of supply & demand and should not lead to conversations of a new housing bubble. Today, we want to look at home prices as compared to current incomes. Here is a graph showing the monthly mortgage payment on a median priced home in the U.S. over the last 25 years: Further Proof This Isn’t a Housing Bubble | Keeping Current MattersMortgage payments are currently well below the historic average over that time period. Purchasers are not overextending themselves to buy a home like they did on the run-up to the housing crash. Lawrence Yun, the Chief Economist at the National Association of Realtors, recently explained in a Forbes article:
“Even though home prices are climbing far above people’s income, exceptionally low mortgage rates have permitted people to buy a home without overstretching their budget. For someone making a 20% down payment, the monthly mortgage payment at today’s mortgage rates would take up 15% of a person’s gross income. During the bubble years, it was reaching 25% of income. The long-term historical average is around 20%. Therefore, a middle-income household does not need to overstretch their budget much if at all to buy a typical home.”

Bottom Line

Due to low interest rates, demand for housing has dramatically increased. This has caused a jump in home prices. However, low interest rates have also allowed the monthly cost of buying a home to remain well below historic norms. We are in a strong housing market, not a housing bubble.

Looking to Buy, Sell, or Invest? Contact:

David Demangos
858.232.8410
Locally Known, Globally Connected
Luxury Home Marketing Specialist
Global Property Specialist

David@AwesomeSanDiegoRealEstate.com
Our Team Goes to Extremes to Fulfill Your Real Estate Dreams!

Sunday, March 27, 2016

Yes, Home Prices Are Rising. No, a New Housing Bubble is NOT Forming

Yes, Home Prices Are Rising. No, a New Housing Bubble is NOT Forming | Keeping Current Matters
We recently reported that home prices are continuing to rise across most of the nation. This has created concern in some pundits that a housing bubble, like we saw ten years ago, is forming again. We want to explain why these concerns are unfounded. The current increase in home values can be easily explained by the theory of supply and demand. Right now, the number of families looking to purchase a home is greater than the supply of homes on the market. Here is a chart that explains how the months’ supply of housing inventory impacts home values: Yes, Home Prices Are Rising. No, a New Housing Bubble is NOT Forming | Keeping Current MattersAccording to the latest Existing Home Sales Report from the National Association of Realtors, there is currently a four-month supply of inventory. That puts us in the blue section of the above graphic. Home prices should be appreciating.

The difference in 2006…

A decade ago, the demand for housing was artificially boosted by lending standards that were far too lenient. Today, the strength of the demand for housing is legitimate, as lending standards are nowhere near what they were a decade ago. For proof of this, let’s look at a graph of the Mortgage Bankers’ Association’s Mortgage Credit Availability Index: Yes, Home Prices Are Rising. No, a New Housing Bubble is NOT Forming | Keeping Current MattersThe higher the number, the easier it was to get a mortgage. We can see that from June 2005 to June 2007, mortgage standards were much more lenient than they have been over the last nine years.

Bottom Line

Today’s price increases, unlike those a decade ago, are the result of qualified buyer demand exceeding the current inventory of homes available for sale. Once the supply increases, prices will level out. 

Looking to Buy, Sell, or Invest? Contact:

David Demangos
858.232.8410
Locally Known, Globally Connected
Luxury Home Marketing Specialist
Global Property Specialist

David@AwesomeSanDiegoRealEstate.com
Our Team Goes to Extremes to Fulfill Your Real Estate Dreams!