Showing posts with label affordability in san diego. Show all posts

Saturday, February 27, 2021

47% of New Buyers Surprised by How Affordable Homes Are Today

Headlines matter. Right now, it’s hard to read about real estate without seeing a headline that suggests homes have become unaffordable for most Americans. In reality, there’s hard evidence that shows how owning a home is more affordable than renting in most parts of the country, as record-low interest rates are keeping monthly mortgage payments about 23% lower than the typical payment of 20 years ago. Despite the facts, misleading headlines persist, and they impact how hopeful homebuyers perceive the market.

In a recent survey by realtor.com, home shoppers indicated they were surprised by what they could actually afford when buying their first home. In fact, 47% discovered their budget was larger than they expected. George Ratiu, Senior Economist at realtor.com, explains:

“For first-time buyers, especially, the drop in the 30-year mortgage rate…has provided unexpected leverage. Lower rates allowed many buyers to stretch and buy more expensive homes while keeping their monthly budget the same.”
So why do these negative headlines that cast doubt on affordability continue to exist?

Most analysts only look at two of the three elements that make up the affordability equation: price and income. It’s true that incomes haven’t kept up with the price of houses. However, affordability is about the cost of the home, not just the price. For that reason, mortgage rates, the third element of the affordability equation, are important to consider.

For example, here’s the typical mortgage payment for assorted dates going back to 2000, as calculated by CoreLogic:
Outside of the housing crash (when short sales and foreclosures drove prices down), it’s more affordable to buy a home today when you consider all three elements of the affordability equation: price, income, and mortgage rate.

Bottom Line

Whether you’re a first-time buyer or a move-up buyer, don’t let the headlines scare you away from your dream of homeownership. Instead, connect with mortgage and real estate professionals to determine what you can afford and what’s available at that price. Like almost half of the buyers in the survey, you may be pleasantly surprised.

Looking to Buy, Sell, or Invest? Contact:

David Demangos - eXp Realty
Cell: 858.232.8410 | Realtor® DRE# 01905183
www.AwesomeSanDiegoRealEstate.com
We Go to Extremes to Fulfill Real Estate Dreams!

San Diego Real Estate Expert | Global Property Specialist
Certified Luxury Marketing Specialist | CLHMS Million Dollar Guild Agent
Green Specialist | Certified International Property Specialist
2016, 2017, 2018,& 2019 Recognition of Excellence Award Winner SDAR

Sunday, August 23, 2020

Homes Are More Affordable Right Now Than They Have Been in Years

Today, home prices are appreciating. When we hear prices are going up, it’s normal to think a home will cost more as the trend continues. The way the housing market is positioned today, however, low mortgage rates are actually making homes more affordable, even as prices rise. Here’s why.

According to the Mortgage Monitor Report from Black Knight:

“While home prices have risen for 97 consecutive months, July’s record-low mortgage rates have made purchasing the average-priced home the most affordable it’s been since 2016.”
How is that possible?

Black Knight continues to explain:

“As of mid-July, it required 19.8% of the median monthly income to make the mortgage payment on the average-priced home purchase, assuming a 20% down payment and a 30-year mortgage. That was more than 5% below the average of 25% from 1995-2003.

This means it currently requires a $1,071 monthly payment to purchase the average-priced home, which is down 6% from the same time last year, despite the average home increasing in value by more than $12,000 during that same time period.

In fact, buying power is now up 10% year-over-year, meaning the average home buyer can afford nearly $32,000 more home than they could at the same time last year, while keeping their monthly payment the same.”

This is great news for the many buyers who were unable to purchase last year, or earlier in the spring due to the slowdown from the pandemic. By waiting a little longer, they can now afford 10% more home than they could have a year ago while keeping their monthly mortgage payment unchanged.

With mortgage rates hitting all-time lows eight times this year, it’s now less expensive to borrow money, making homes significantly more affordable over the lifetime of your loan. Mark Fleming, Chief Economist at First American, shares what low mortgage rates mean for affordability:

“In July, house-buying power got a big boost as the 30-year, fixed mortgage rate made history by moving below three percent. That drop in the mortgage rate from 3.23 percent in May to 2.98 percent in July increased house-buying power by nearly $15,000.”

The map below shows the last time homes were this affordable by state:


In six states – Arkansas, Iowa, Kentucky, Louisiana, Maryland, and West Virginia – homes have not been this affordable in more than 25 years.

Bottom Line

If you’re thinking of making a move, now is a great time to take advantage of the affordability that comes with such low mortgage rates. Whether you’re thinking of purchasing your first home or moving into a new one and securing a significantly lower mortgage rate than you may have on your current house, let’s connect today to determine your next steps in the process.

Looking to Buy, Sell, or Invest? Contact:

David Demangos - eXp Realty
Cell: 858.232.8410 | Realtor® DRE# 01905183
www.AwesomeSanDiegoRealEstate.com
We Go to Extremes to Fulfill Real Estate Dreams!

San Diego Real Estate Expert | Global Property Specialist
Certified Luxury Marketing Specialist | CLHMS Million Dollar Guild Agent
Green Specialist | Certified International Property Specialist
2016, 2017, 2018,& 2019 Recognition of Excellence Award Winner SDAR

Saturday, August 24, 2019

Busting the Myth About a Housing Affordability Crisis

It seems you can’t find a headline with the term “housing affordability” without the word “crisis” attached to it. That’s because some only consider the fact that residential real estate prices have continued to appreciate. However, we must realize it’s not just the price of a home that matters, but the price relative to a purchaser’s buying power.

Homes, in most cases, are purchased with a mortgage. The current mortgage rate is a major component of the affordability equation. Mortgage rates have fallen by over a full percentage point since December 2018. Another major piece of the affordability equation is a buyer’s income. The median family income has risen by 3.5% over the last year.

Let’s look at three different reports issued recently that reveal how homes are very affordable in comparison to historic numbers, and how they have become even more affordable over the past several months.


1. National Association of Realtors’ (NAR) Housing Affordability Index:

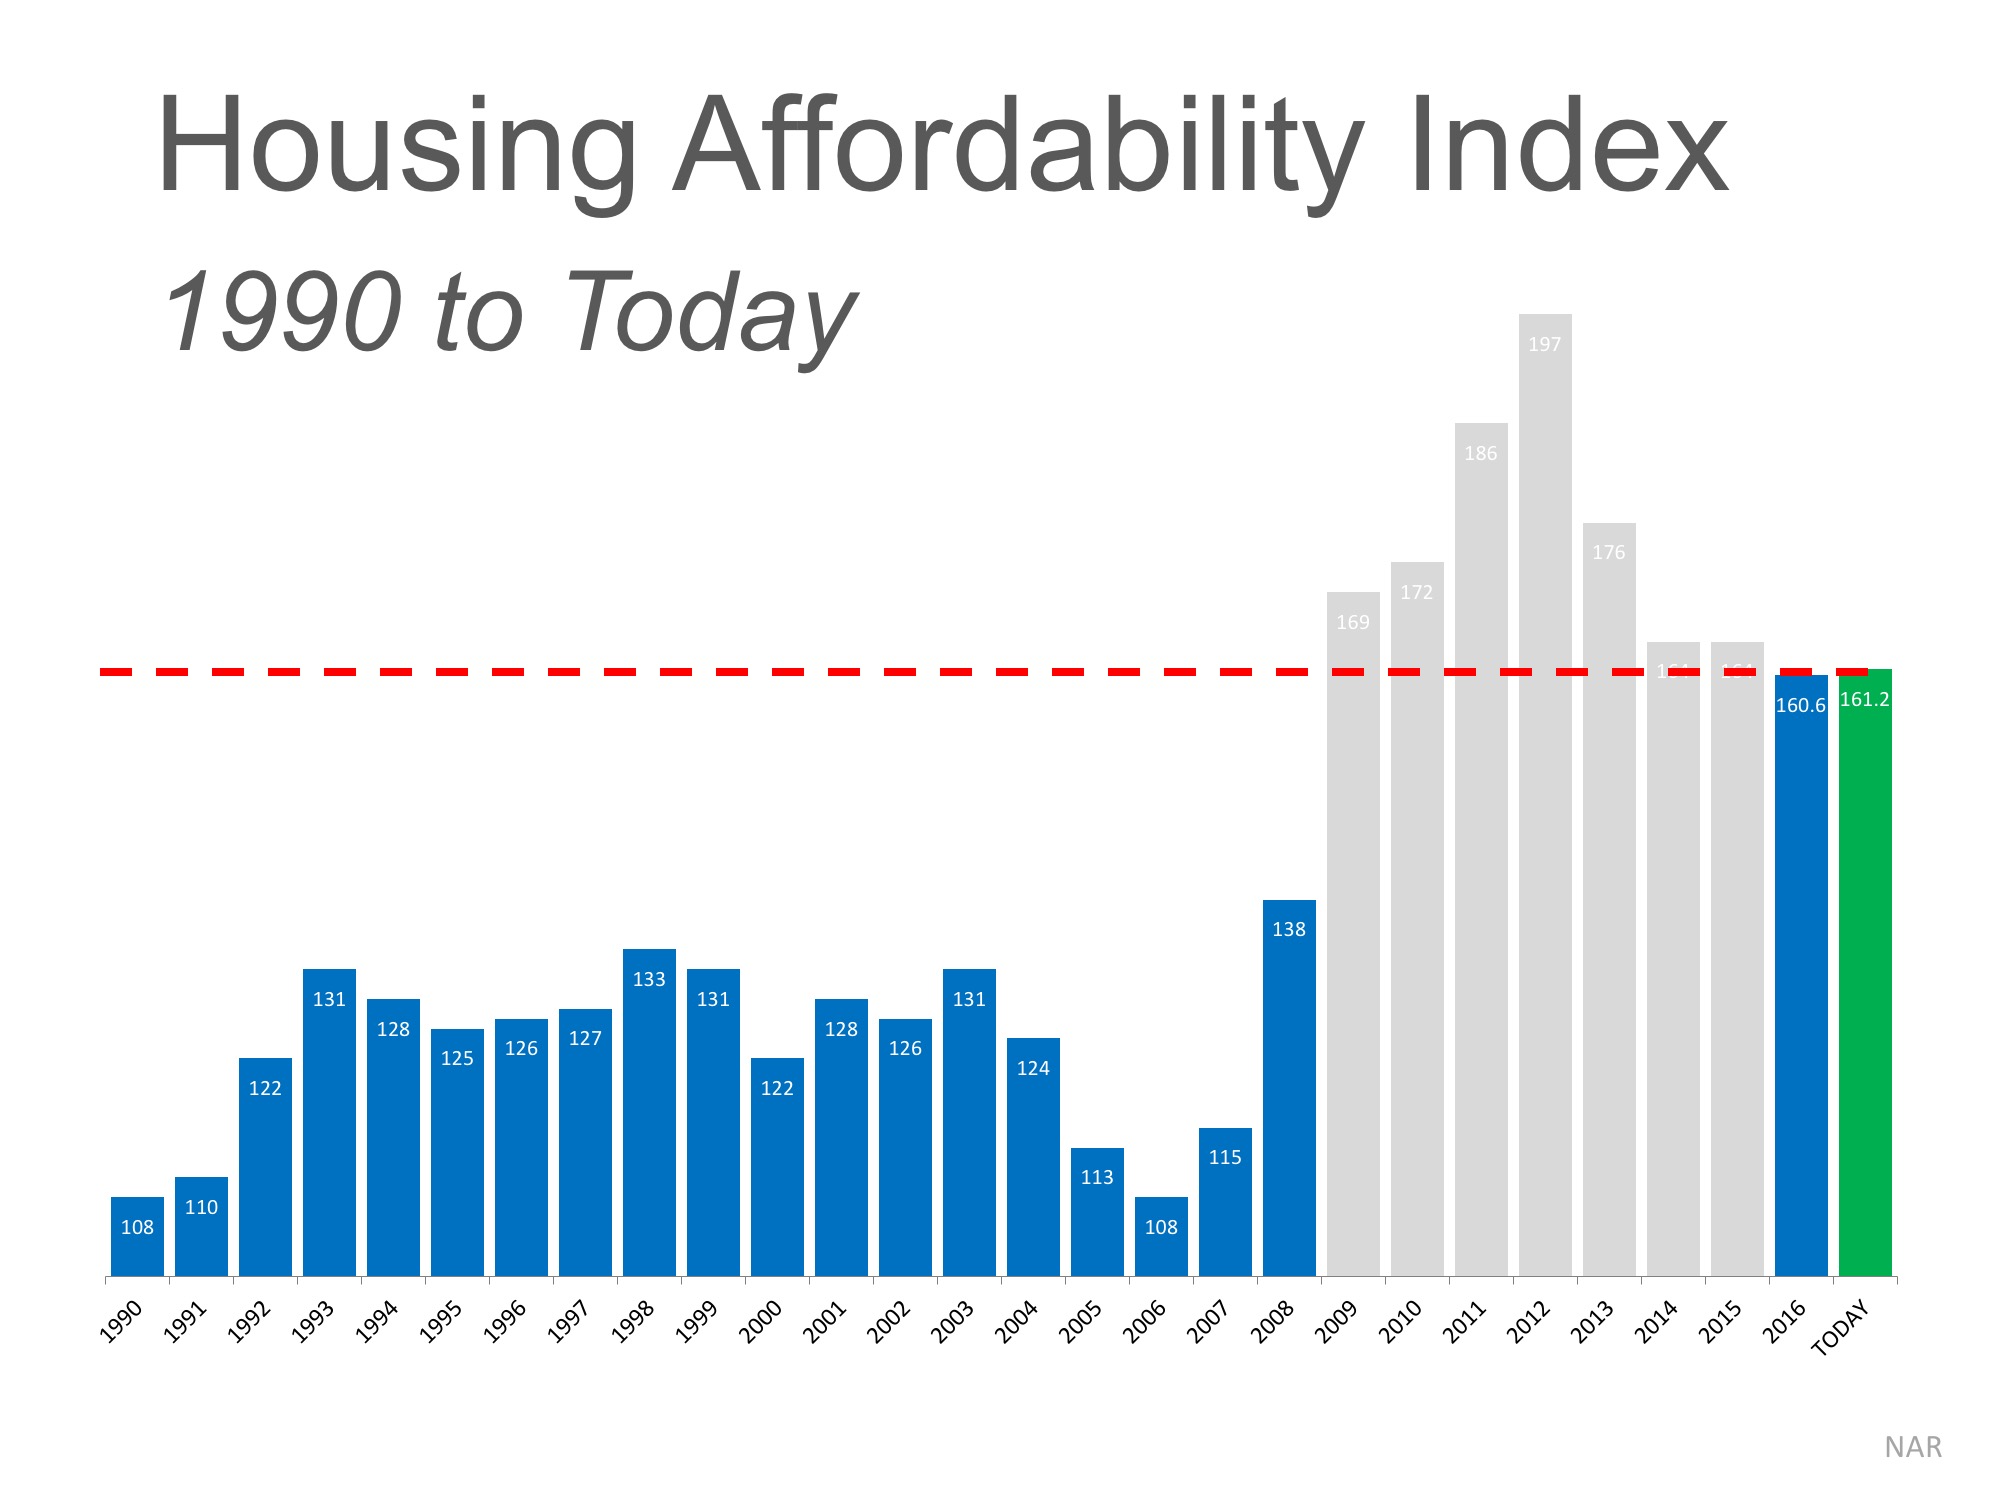
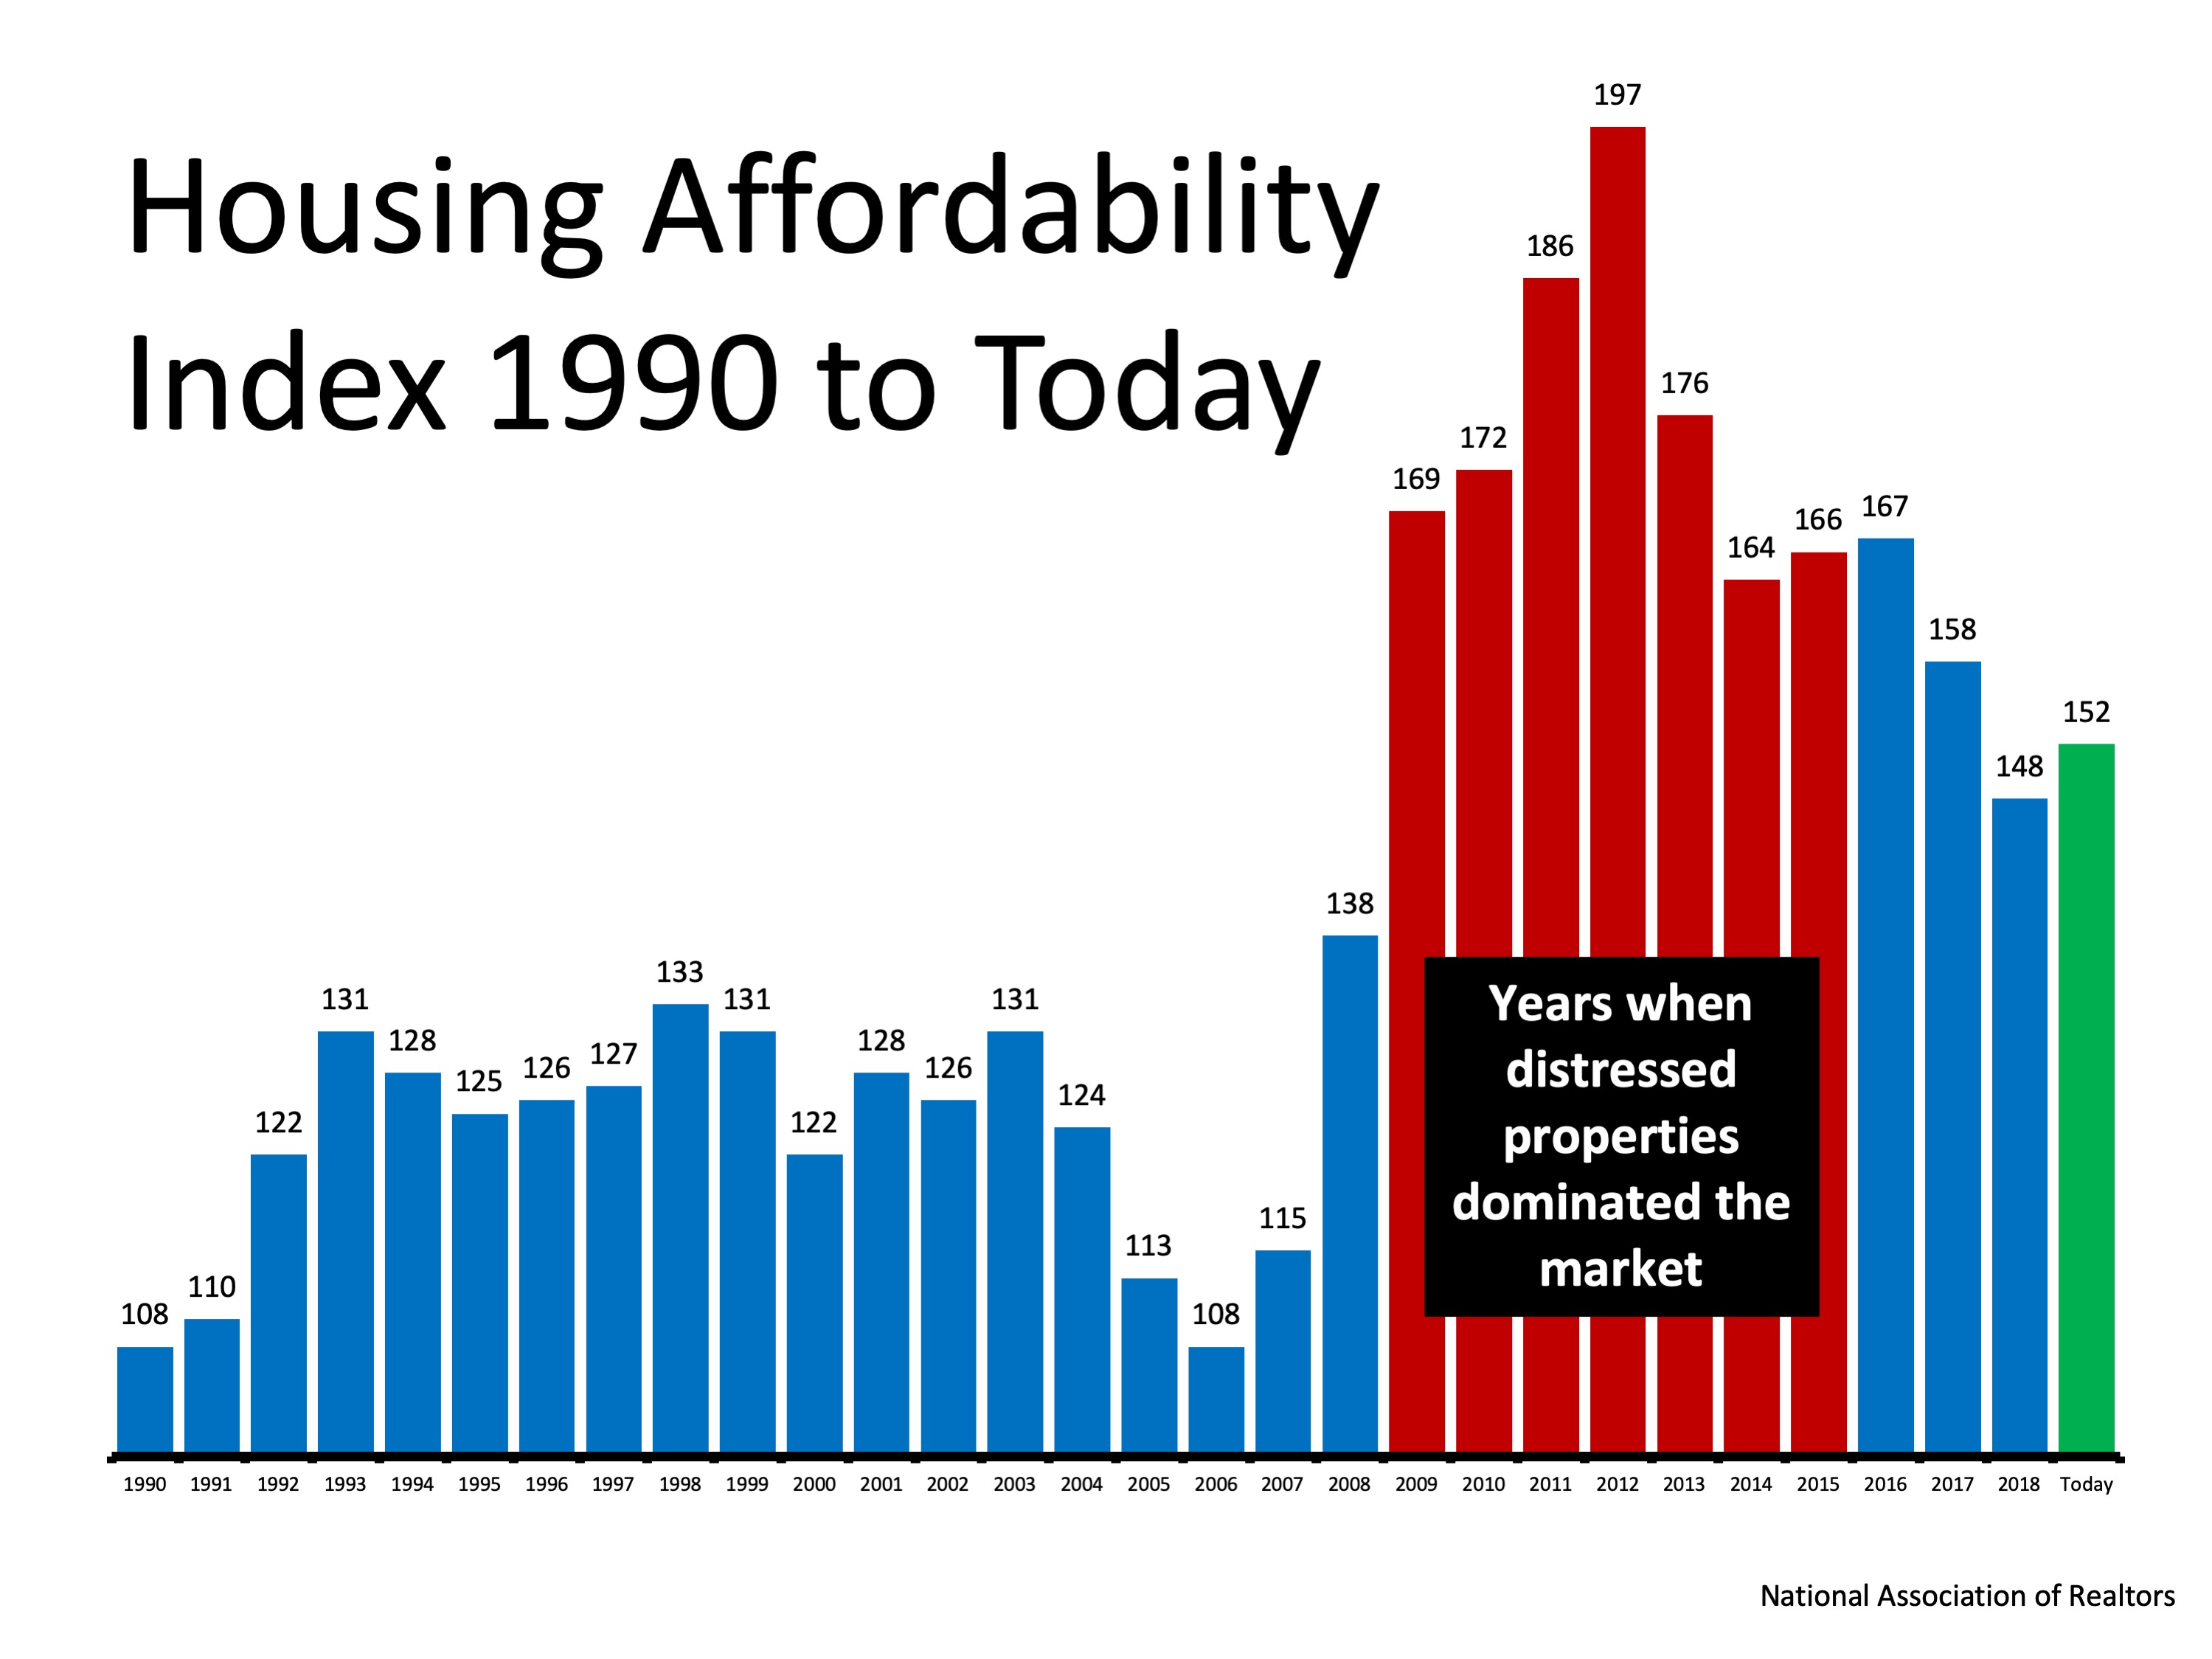
Here is a graph showing the index going all the way back to 1990. The higher the column, the more affordable homes are:
We can see that homes are less affordable today (the green bar) than they were during the housing crash (the red bars). This was when distressed properties like foreclosures and short sales saturated the market and sold for massive discounts. However, homes are more affordable today than at any time from 1990 to 2008.

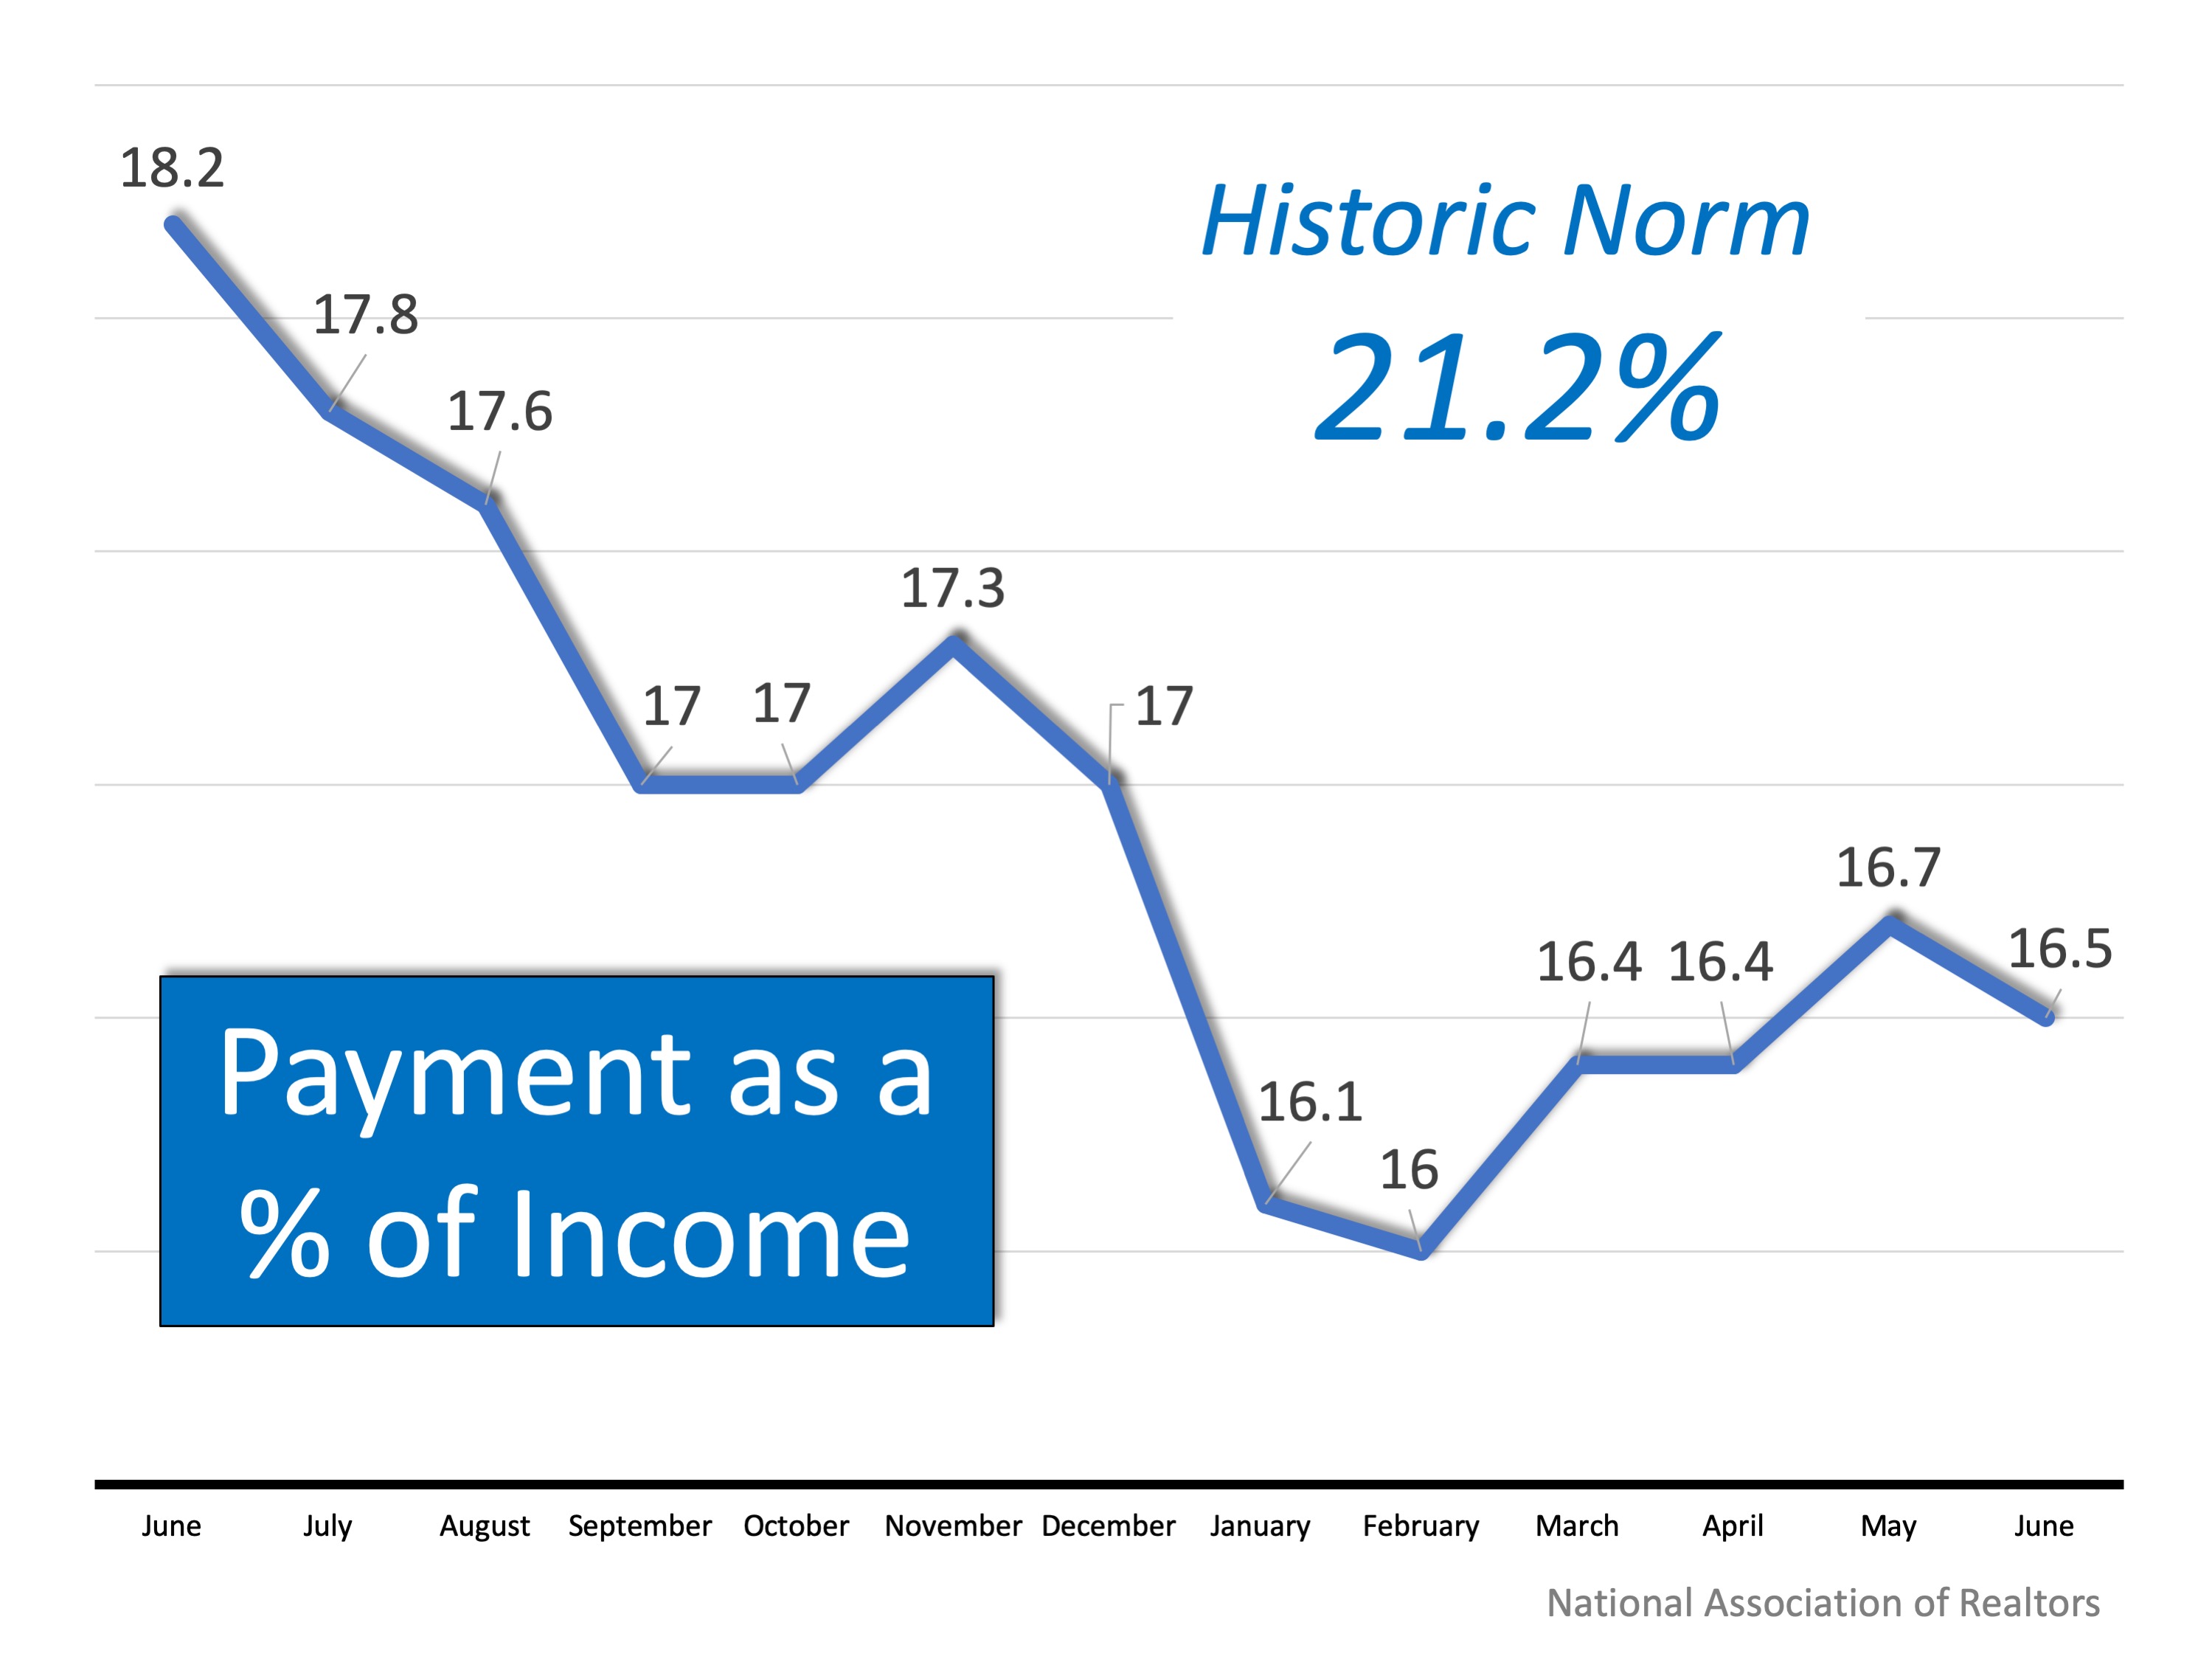
NAR’s report on the index also shows that the percentage of a family’s income needed for a mortgage payment (16.5%) is dramatically lower than last year and is well below the historic 
norm of 21.2% 


2. Black Knight’s Mortgage Monitor:

This report reveals that as a result of falling interest rates and slowing home price appreciation, affordability is the best it has been in 18 months. Black Knight Data & Analytics President Ben Graboske explains:

“For much of the past year and a half, affordability pressures have put a damper on home price appreciation. Indeed, the rate of annual home price growth has declined for 15 consecutive months. More recently, declining 30-year fixed interest rates have helped to ease some of those pressures, improving the affordability outlook considerably…And despite the average home price rising by more than $12K since November, today’s lower fixed interest rates have worked out to a $108 lower monthly payment…Lower rates have also increased the buying power for prospective homebuyers looking to purchase the average-priced home by the equivalent of 15%.”

3. First American’s Real House Price Index:

While affordability has increased recently, Mark Fleming, First American’s Chief Economist explains:

“If the 30-year, fixed-rate mortgage declines just a fraction more, consumer house-buying power would reach its highest level in almost 20 years.”

Fleming goes on to say that the gains in affordability are about mortgage rates and the increase in family incomes:

“Average nominal household incomes are nearly 57 percent higher today than in January 2000. Record income levels combined with mortgage rates near historic lows mean consumer house-buying power is more than 150 percent greater today than it was in January 2000.”

Bottom Line

If you’ve put off the purchase of a first home or a move-up home because of affordability concerns, you should take another look at your ability to purchase in today’s market. You may be pleasantly surprised!

Looking to Buy, Sell, or Invest? Contact:

David Demangos - Keller Williams Realty
Cell: 858.232.8410 | Realtor® DRE# 01905183
www.AwesomeSanDiegoRealEstate.com
Our Team Goes to Extremes to Fulfill Your Real Estate Dreams!

San Diego Real Estate Expert | Global Property Specialist
Certified Luxury Marketing Specialist | CLHMS Million Dollar Guild Agent
Green Specialist | Certified International Property Specialist
2016, 2017 & 2018 Recognition of Excellence Award Winner SDAR

Sunday, April 9, 2017

The 'REAL' News about Housing Affordability

Some industry experts are claiming that the housing market may be headed for a slowdown as we proceed through 2017, based on rising home prices and a potential jump in mortgage interest rates. One of the data points they use is the Housing Affordability Index, as reported by the National Association of Realtors (NAR).

Here is how NAR defines the index:

“The Housing Affordability Index measures whether or not a typical family earns enough income to qualify for a mortgage loan on a typical home at the national level based on the most recent price and income data.”

Basically, a value of 100 means a family earning the median income earns enough to qualify for a mortgage on a median-priced home, based on the price and mortgage interest rates at the time. Anything above 100 means the family has more than enough to qualify.

The higher the index, the easier it is to afford a home.
Why the concern?

The index has been declining over the last several years as home values increased. Some are concerned that too many buyers could be priced out of the market.

But, wait a minute…

Though the index skyrocketed from 2009 through 2013, we must realize that during that time, the housing crisis left the market with an overabundance of distressed properties (foreclosures and short sales). All prices dropped dramatically and distressed properties sold at major discounts. Then, mortgage rates fell like a rock.

The market is recovering, and values are coming back nicely. That has caused the index to fall.

However, let’s remove the crisis years (shaded in gray) and look at the current index as compared to the index from 1990 – 2008:


Though prices and rates appear to be increasing, we must realize that affordability is composed of three ingredients: home prices, interest rates, and income. And, incomes are finally rising.

ATTOM Data Solutions recently released their Q1 2017 U.S. Home Affordability Index.

 The report explained:

“Stronger wage growth is the silver lining in this report, outpacing home price growth in more than half of the markets for the first time since Q1 2012, when median home prices were still falling nationwide. If that pattern continues, it will help turn the tide in the eroding home affordability trend.”


Bottom Line


Compared to historic norms, it is still a great time to buy from an affordability standpoint.


Looking to Buy, Sell, or Invest? Contact:

David Demangos - Keller Williams Realty
Cell: 858.232.8410 | Realtor® BRE# 01905183
www.AwesomeSanDiegoRealEstate.com
Our Team Goes to Extremes to Fulfill Your Real Estate Dreams!

San Diego Real Estate Expert | Global Property Specialist
Certified Luxury Marketing Specialist | CLHMS Million Dollar Guild Agent
Green Specialist | Certified International Property Specialist
2016 Recognition of Excellence Award Winner SDAR

Wednesday, August 31, 2016

4 Stats That PROVE This Is NOT 2005 All over Again

Recent research by realtor.com examined certain red flags that caused the housing crisis in 2005, and then compared them to today’s real estate market. Today, we want to concentrate on four of those red flags.

  • Price to Rent Ratio
  • Price to Income Ratio
  • Mortgage Transactions
  • House Flipping

All four categories were outside historical norms in 2005. Home prices were way above normal ratios when compared to both rents and incomes at the time.

They explained that mortgage transactions as a percentage of all home sales were also at a higher percentage:

“Loose credit was one of the main culprits of the housing crisis. Mortgage lending expanded dramatically as unhealthy housing speculation reached its peak and was met by the highest level of credit availability as measured by the Mortgage Bankers Association. The index measures the overall mortgage credit condition by the share of home sales financed by mortgages. This metric does not capture credit quality, but it does set a view of the importance of financing in supporting the housing market.”

House flipping was rampant in 2005.
As realtor.com's research points out:

“Heightened flipping activity is a clear indication of speculation in the real estate market. A property is considered as a speculative flip if the property is sold twice within 12 months and with positive profit. Flipping is a normal part of a healthy housing market. In an inflated housing market, expectations about short-term profit from pure price appreciation are very high; therefore, the level of flipping activity would show evidence of being heightened.”

Here are the categories with percentages reflecting the unrealistic ratios & numbers of 2005 as compared to the current market. Remember, a negative percentage reflects a positive gain for the market.


Bottom Line
They say hindsight is 20/20… Today, experts are keeping a close watch on the potential red flags that went unnoticed in 2005.

Looking to Buy, Sell, or Invest? Contact:

David Demangos
858.232.8410
Locally Known, Globally Connected
Luxury Home Marketing Specialist
Global Property Specialist

David@AwesomeSanDiegoRealEstate.com
Our Team Goes to Extremes to Fulfill Your Real Estate Dreams!