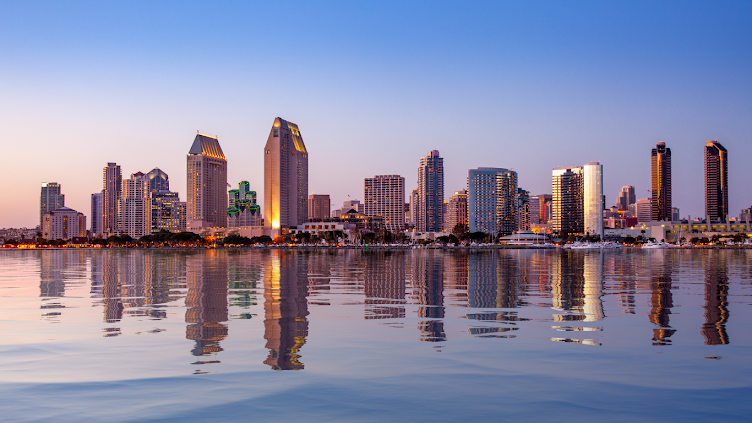
San Diego has always been a coveted destination, and 2026 is no exception. Whether you're drawn by the beautiful beaches, the vibrant culture, or the booming job market, here’s a comprehensive guide to help you settle in.
1. Cost of Living
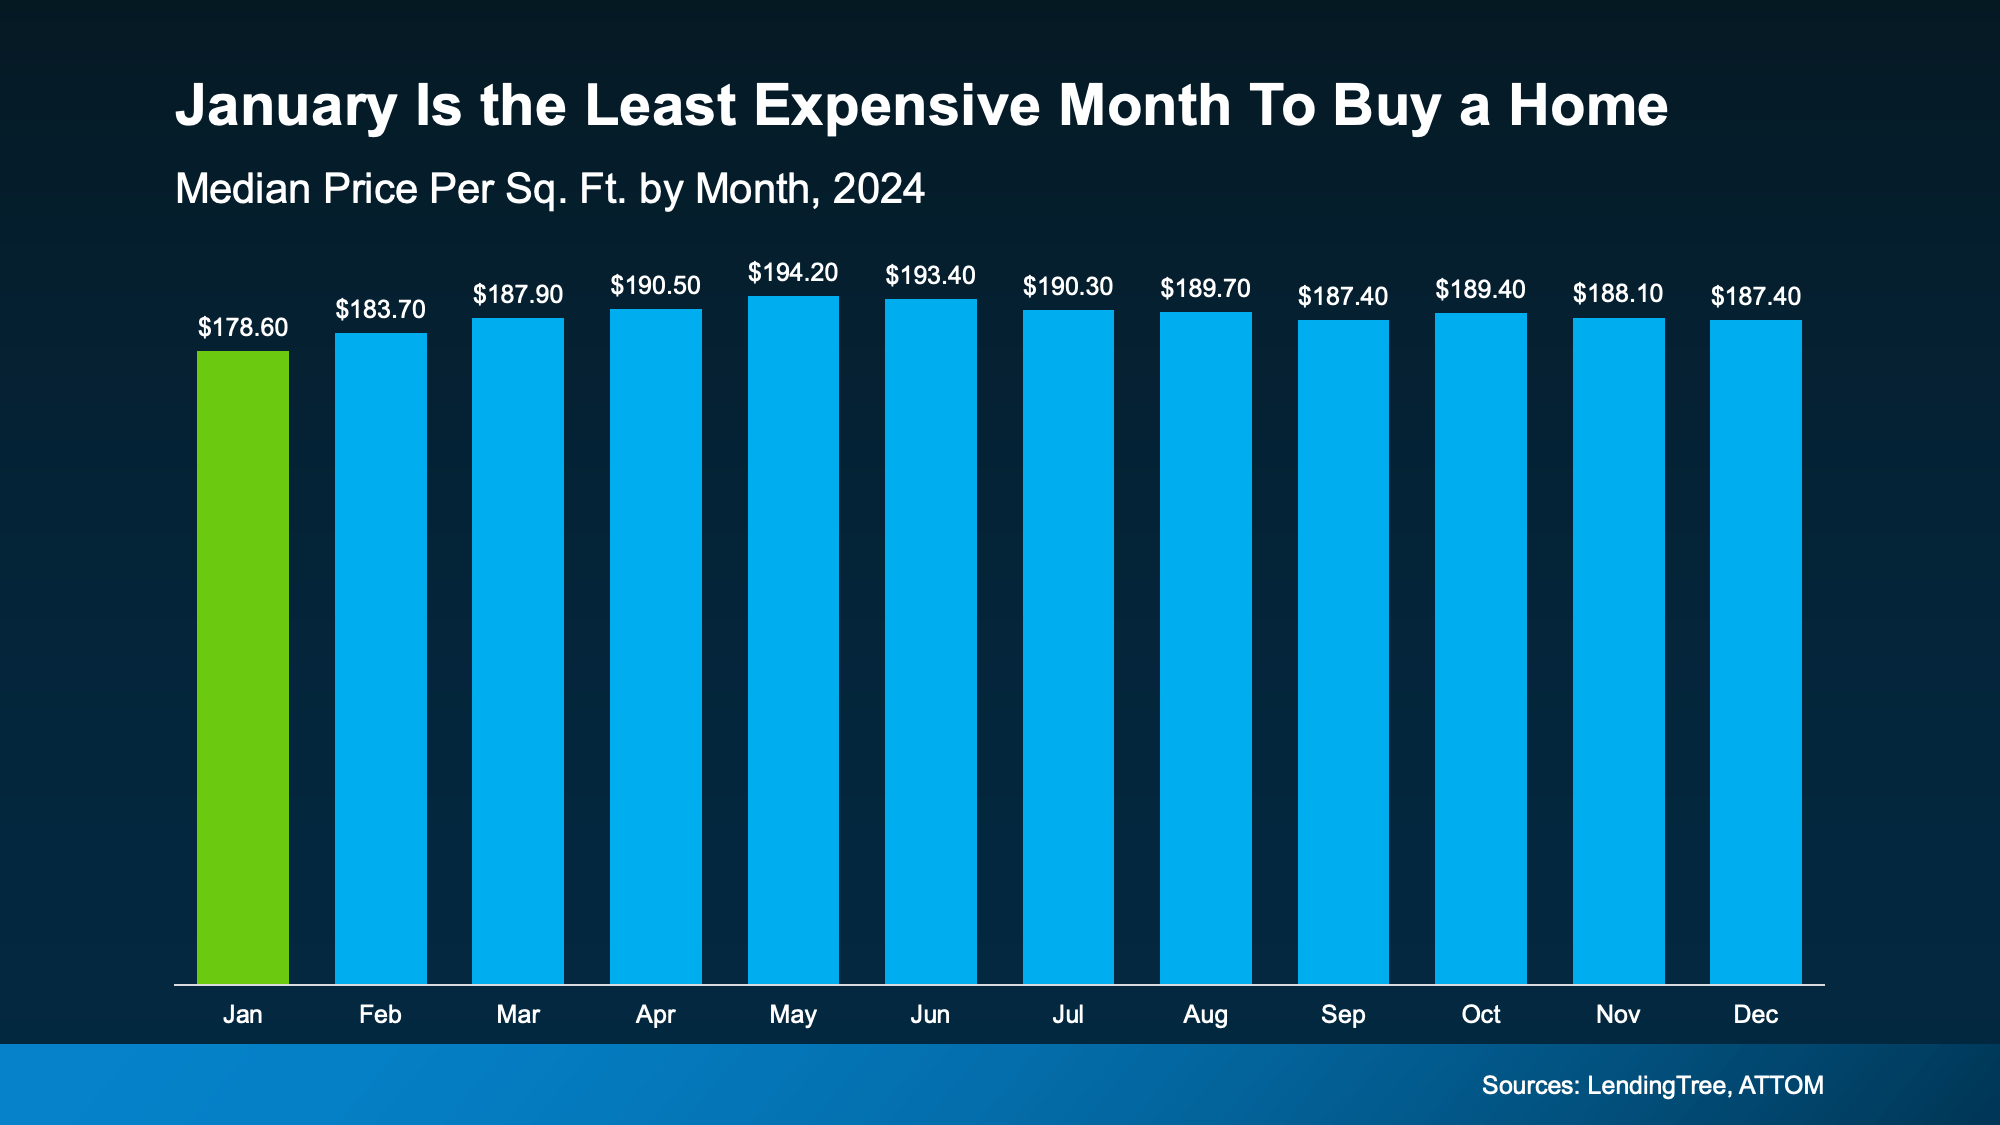
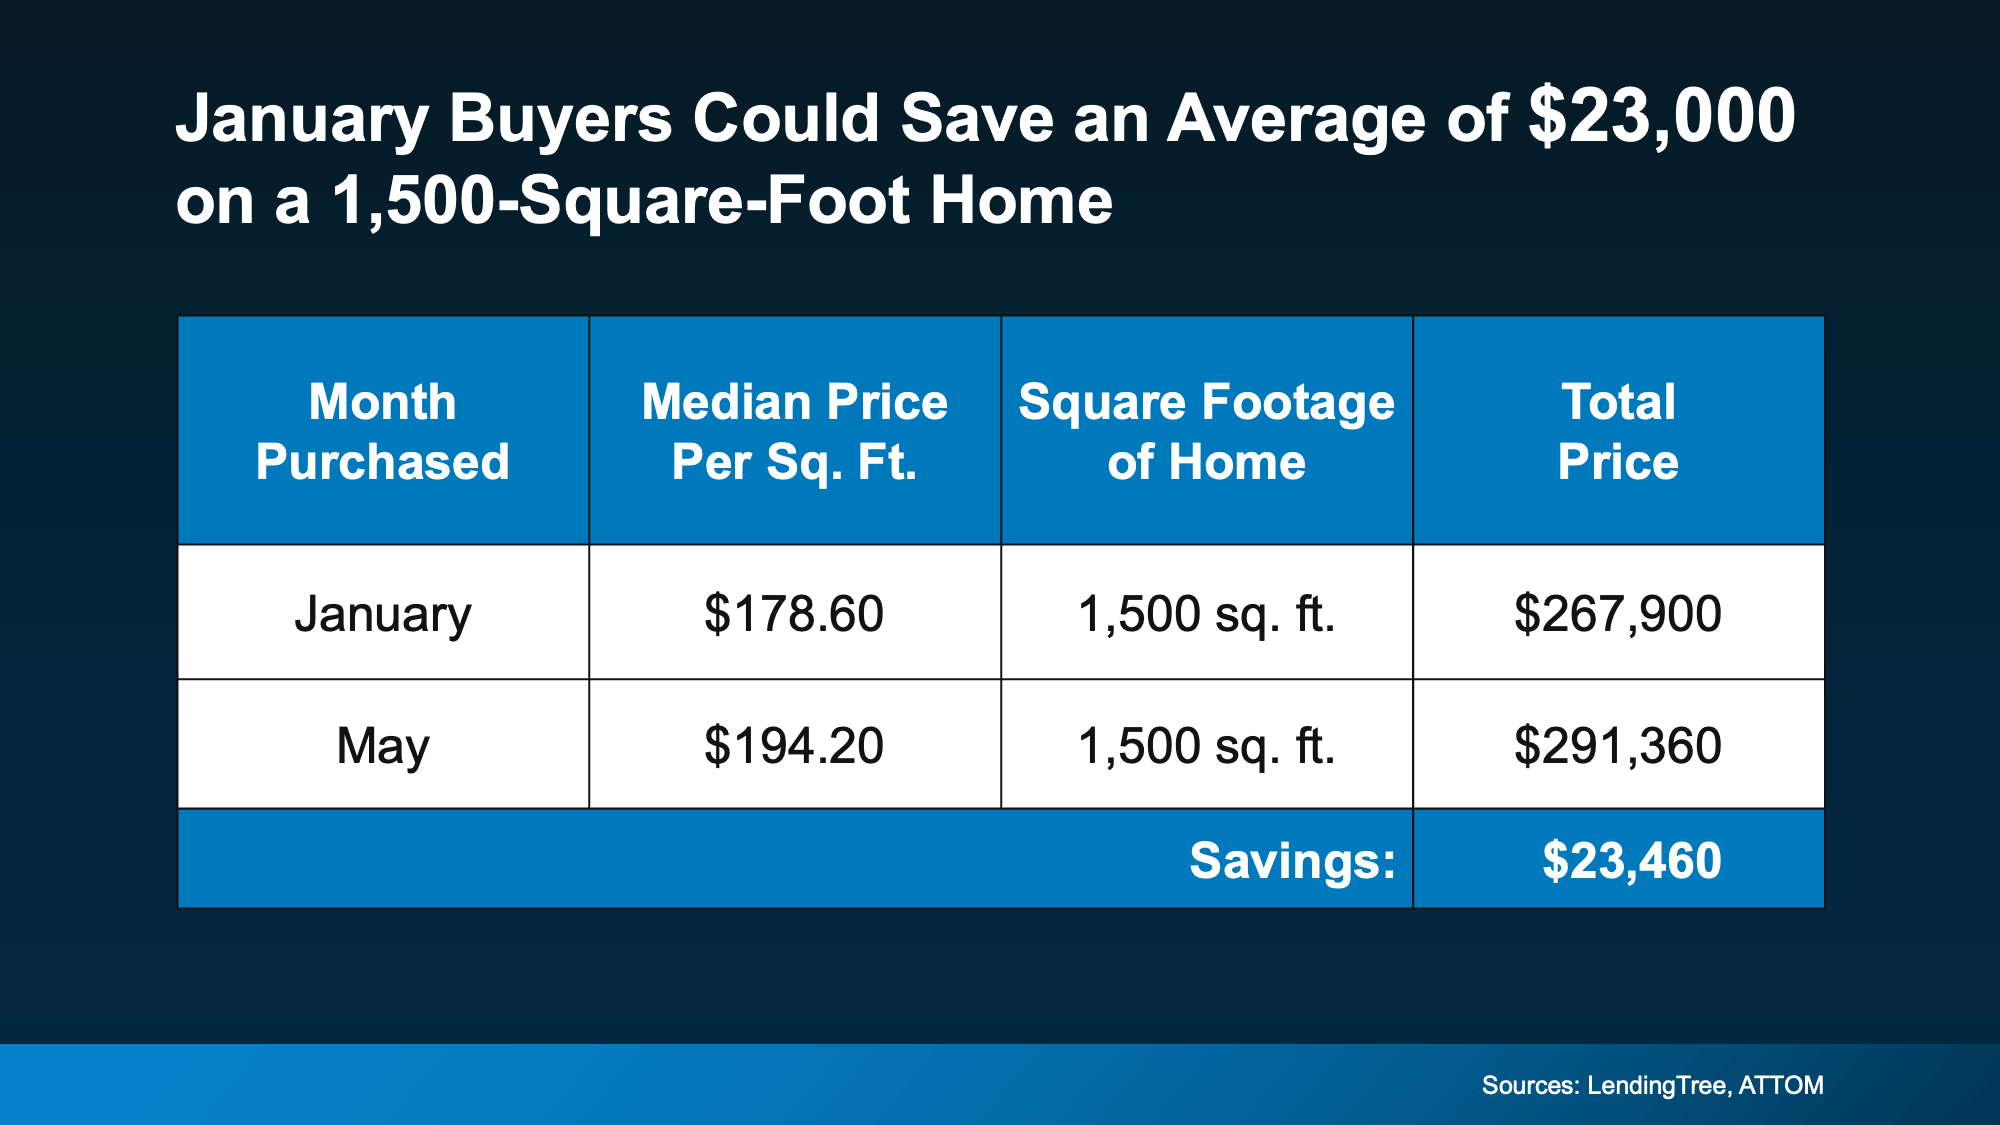
San Diego is known for its relatively high cost of living. Housing, in particular, tends to be the largest expense. While prices can vary depending on the neighborhood, you can expect higher-than-average rent and home prices compared to other U.S. cities.
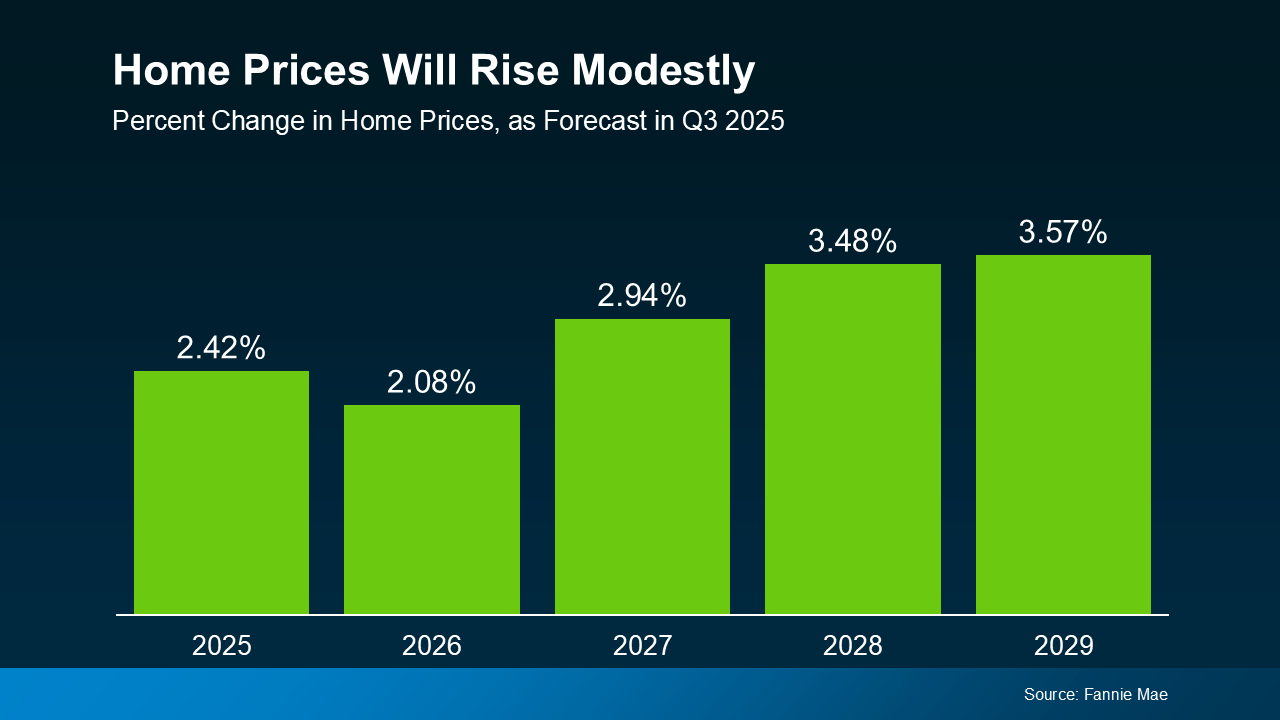
2. Housing Market
The San Diego real estate market remains competitive. In 2026, you’ll find a mix of modern condos, charming bungalows, and spacious family homes. It’s essential to work with a local realtor to navigate the market effectively and find a property that fits your budget and lifestyle.
3. Job Market
San Diego’s economy is diverse, with strong sectors in biotechnology, telecommunications, defense, and tourism. The city also has a growing startup scene, making it an attractive destination for young professionals and entrepreneurs.
4. Lifestyle and Culture
From its world-famous beaches like La Jolla and Pacific Beach to its thriving arts scene, San Diego offers a laid-back yet vibrant lifestyle. There are plenty of outdoor activities, including hiking, surfing, and biking, as well as a rich culinary scene featuring fresh seafood and innovative cuisine.
5. Transportation
San Diego boasts a well-connected public transit system, including trolleys and buses, but many residents prefer driving. With ongoing infrastructure improvements, commuting is becoming more convenient.
6. Education and Schools
For families, San Diego offers a range of highly rated public and private schools, as well as prestigious universities such as UC San Diego. Education options are plentiful and cater to a diverse population.
7. Weather
One of San Diego’s biggest draws is its mild, Mediterranean climate. Expect plenty of sunshine and comfortable temperatures year-round, making it perfect for outdoor enthusiasts.
Moving to San Diego in 2026 promises a blend of opportunities and a high quality of life. With careful planning and a bit of local insight, you’ll find yourself right at home in this dynamic coastal city.
Ready to Make the Move?
If you’re considering relocating to San Diego or need assistance with buying or selling property, feel free to reach out to me:
David Demangos - eXp Realty
Cell: 858.232.8410 | Realtor® DRE# 01905183
www.AwesomeSanDiegoRealEstate.com
We Go to Extremes to Fulfill Real Estate Dreams