Tuesday, September 2, 2025

What Everyone’s Getting Wrong About the Rise in New Home Inventory

You may have seen talk online that new home inventory is at its highest level since the crash. And if you lived through the crash back in 2008, seeing new construction is up again may feel a little scary.

But here’s what you need to remember: a lot of what you see online is designed to get clicks. So, you may not be getting the full story. A closer look at the data and a little expert insight can change your perspective completely.

Why This Isn’t Like 2008

While it’s true the number of new homes on the market hit its highest level since the crash, that’s not a reason to worry. That’s because new builds are just one piece of the puzzle. They don’t tell the full story of what’s happening today.

To get the real picture of how much inventory we have and how it compares to the surplus we saw back then, you’ve got to look at both new homes and existing homes (homes that were lived in by a previous owner).

When you combine those two numbers, it’s clear overall supply looks very different today than it did around the crash (see graph below):
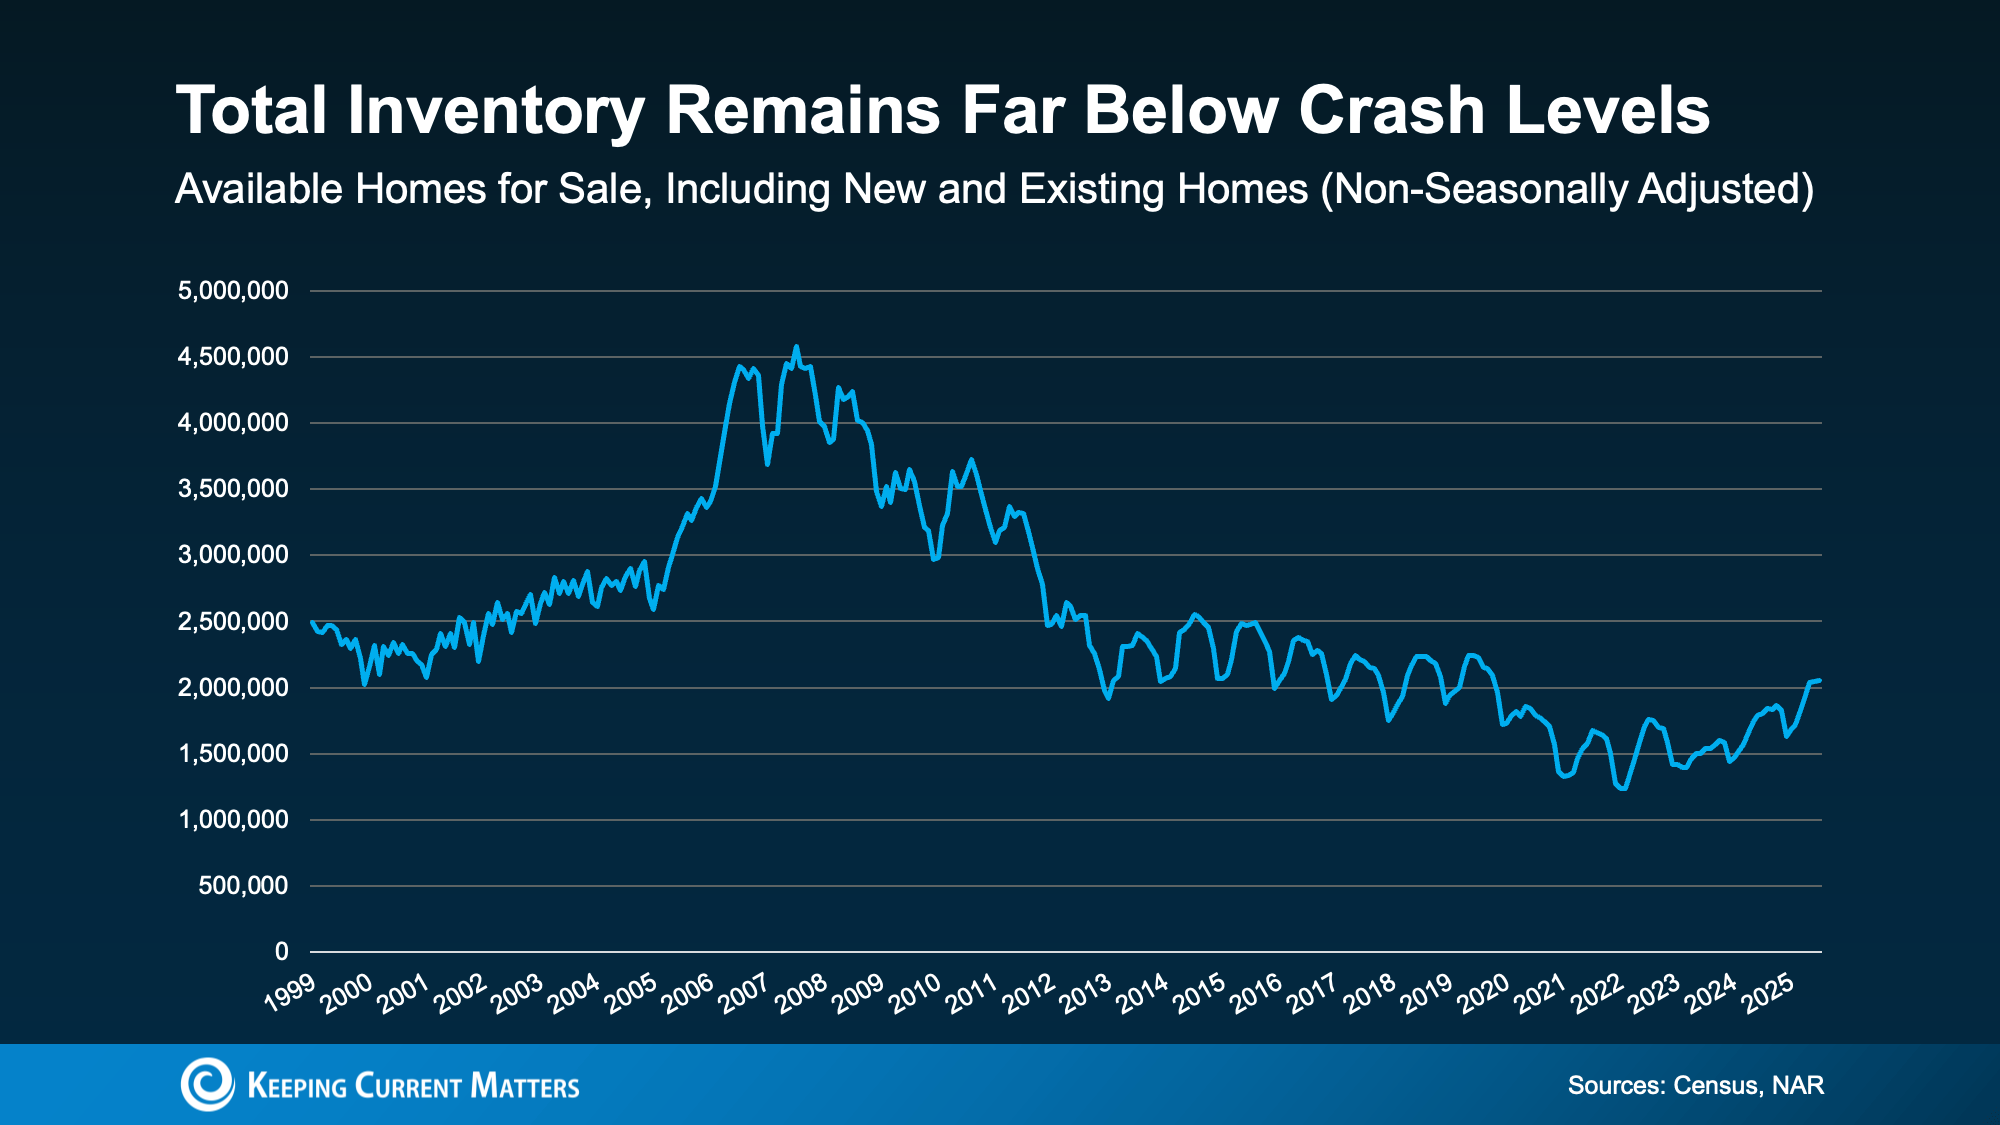
So, saying we’re near 2008 levels for new construction isn’t the same as the inventory surplus we had the last time.

Builders Have Actually Underbuilt for Over a Decade

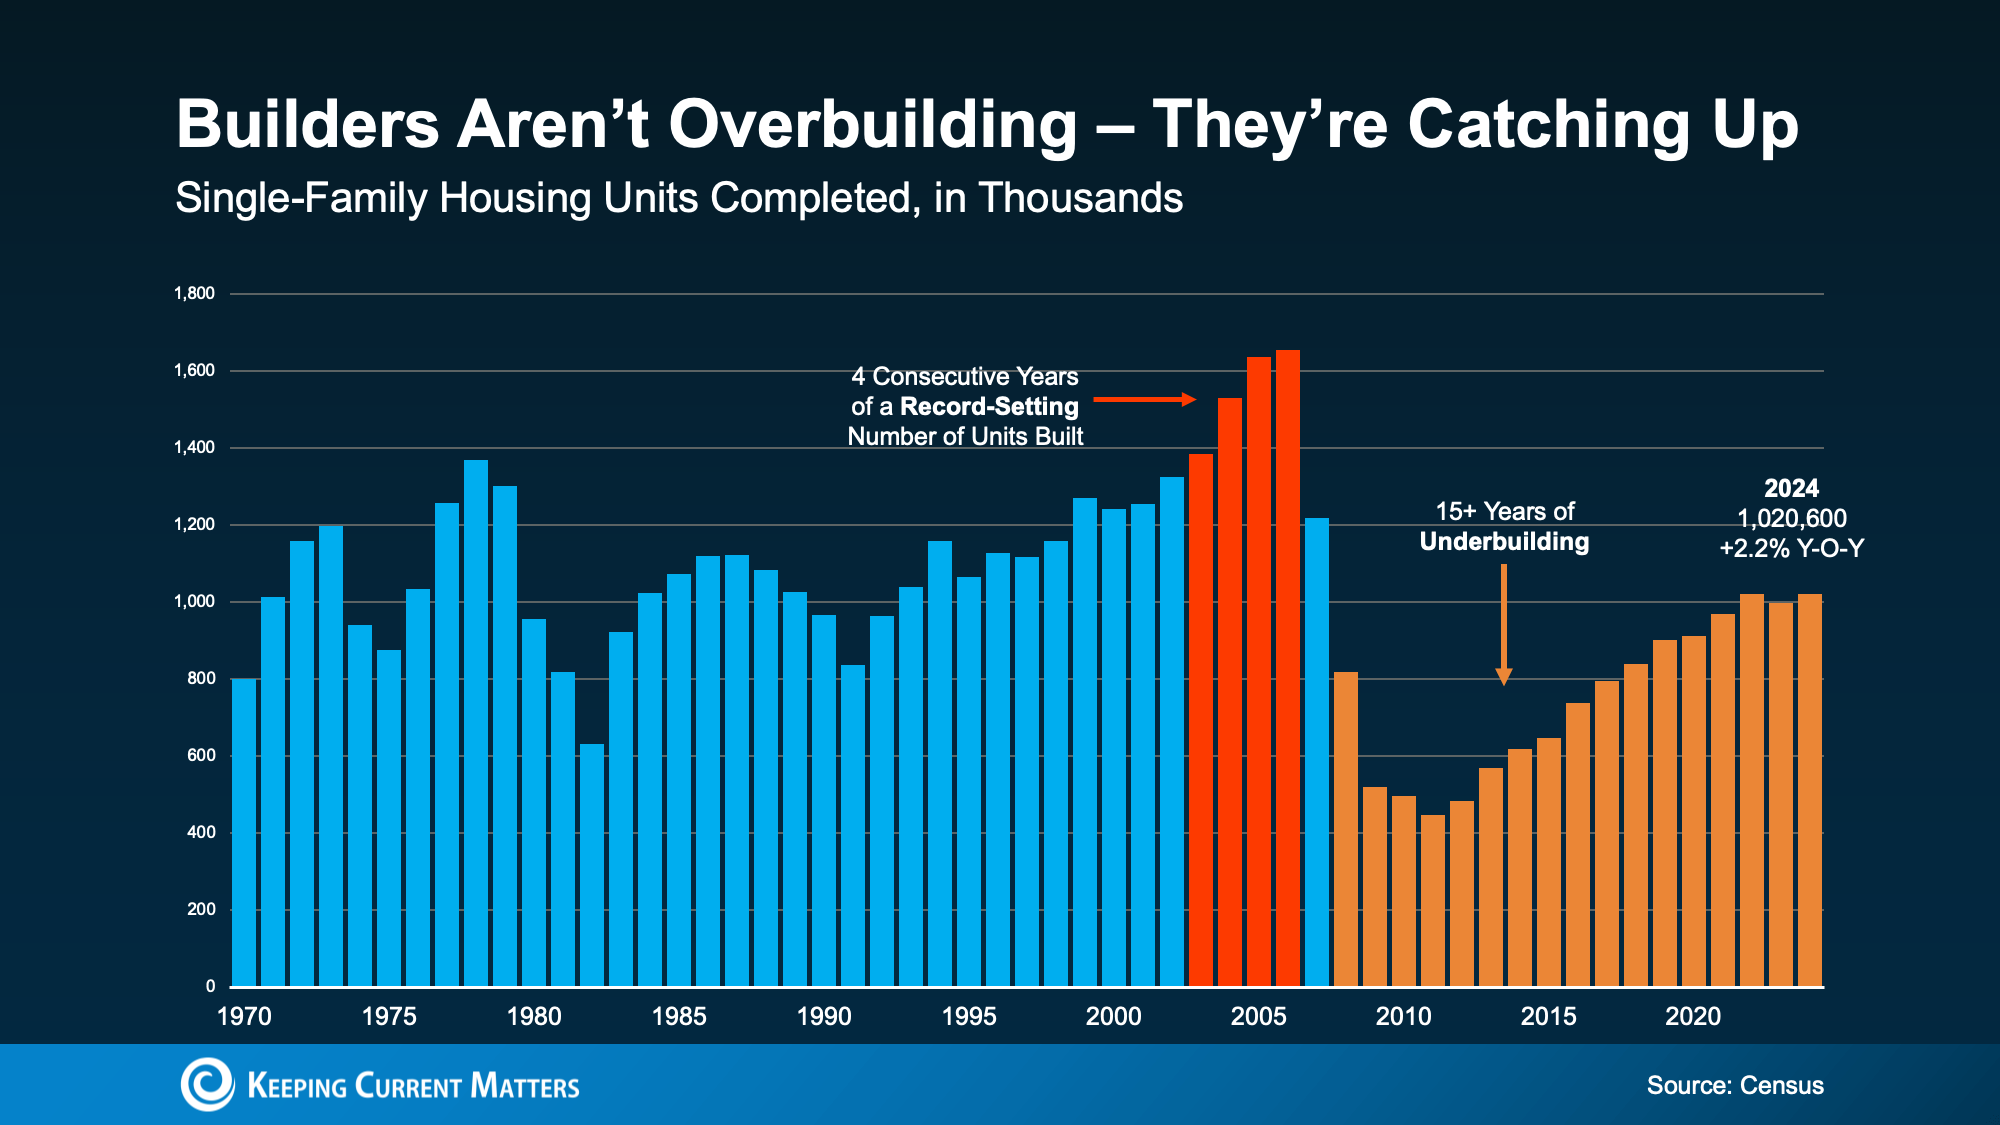
And here’s some other important perspective you’re not going to get from those headlines. After the 2008 crash, builders slammed on the brakes. For 15 years, they didn’t build enough homes to keep up with demand. That long stretch of underbuilding created a major housing shortage, which we’re still dealing with today.

The graph below uses Census data to show the overbuilding leading up to the crash (in red), and the period of underbuilding that followed (in orange):

a graph of a number of unitsBasically, we had more than 15 straight years of underbuilding – and we’re only recently starting to slowly climb out of that hole. But there’s still a long way to go (even with the growth we’ve seen lately). Experts at Realtor.com say it would take roughly 7.5 years to build enough homes to close the gap.
Of course, like anything else in real estate, the level of supply and demand is going to vary by market. Some markets may have more homes for sale, some less. But nationally, this isn’t like the last time.

Bottom Line

Just because there are more new homes for sale right now, it doesn’t mean we’re headed for a crash. The data shows today’s overall inventory situation is different.

If you have questions or want to talk about what builders are doing in your area, connect with me below.

David Demangos - eXp Realty
Cell: 858.232.8410 | Realtor® DRE# 01905183
www.AwesomeSanDiegoRealEstate.com
We Go to Extremes to Fulfill Real Estate Dreams

Friday, July 25, 2025

The U.S. Foreclosure Map You Need To See

Foreclosure headlines are making noise again – and they’re designed to stir up fear to get you to read them. But what the data shows is actually happening in the market tells a very different story than what you might be led to believe. So, before you jump to conclusions, it’s important to look at the full picture.

Yes, foreclosure starts are up 7% in the first six months of the year. But zooming out shows that’s nowhere near crisis levels. Here’s why.

Filings Are Still Far Below Crash Levels

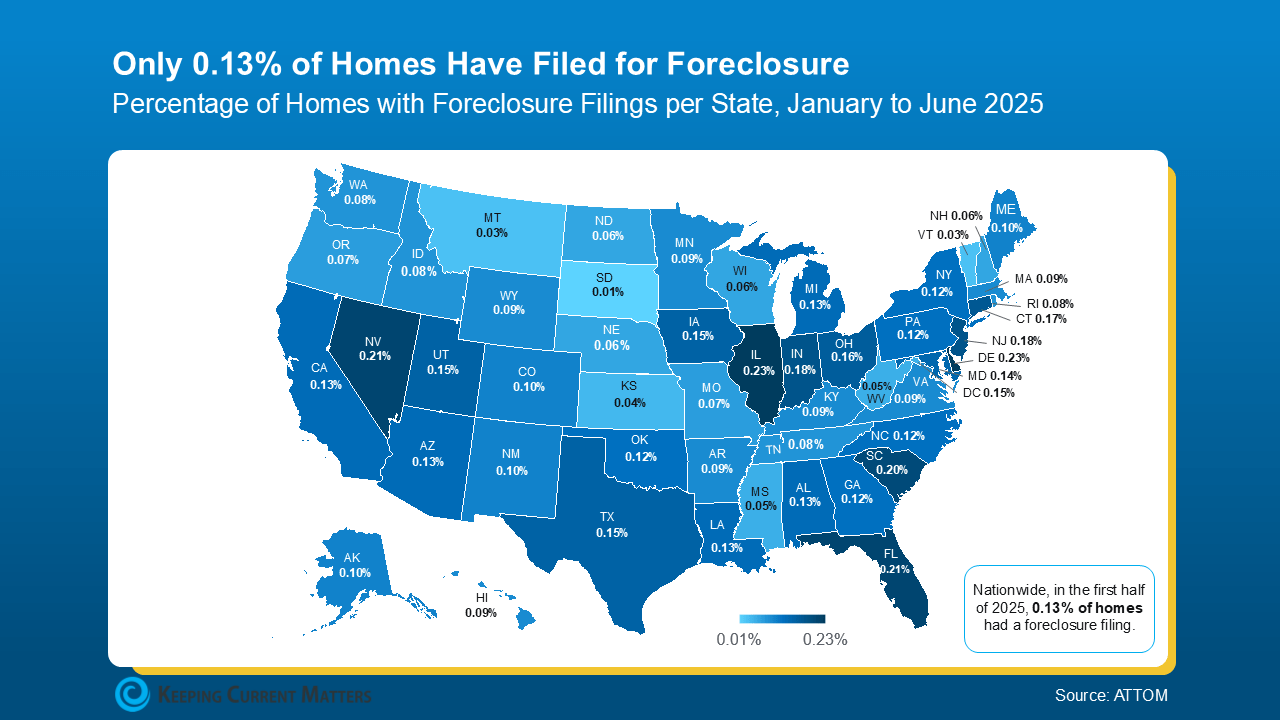
Even with the recent uptick, overall foreclosure filings are still very low. In the first half of 2025, just 0.13% of homes had filed for foreclosure. That’s less than 1% of homes in this country. In fact, it’s even far less than that at under a quarter of a percent. That’s a very small fraction of all the homes out there. But like with anything else in real estate, the numbers vary by market.

Here’s the map you need to see that shows how foreclosure rates are lower than you might think, and how they differ by local area:

a map of the united statesFor context, data from ATTOM shows in the first half of 2025, 1 in every 758 homes nationwide had a foreclosure filing. Thats the 0.13% you can see in the map above. But in 2010, back during the crash? Mortgage News Daily says it was 1 in every 45 homes.

Today’s Numbers Don’t Indicate a Market in Trouble

But here’s what everyone remembers…

Leading up to the crash, risky lending practices left homeowners with payments they eventually couldn’t afford. That led to a situation where many homeowners were underwater on their mortgages. When they couldn’t make their payments, they had no choice but to walk away. Foreclosures surged, and the market ultimately crashed.

Today’s housing market is very different. Lending standards are stronger. Homeowners have near record levels of equity. And when someone hits financial trouble, that equity means many people can sell their home rather than face foreclosure. As Rick Sharga, Founder of CJ Patrick Company, explains:

“. . . a significant factor contributing to today’s comparatively low levels of foreclosure activity is that homeowners—including those in foreclosure—possess an unprecedented amount of home equity.”

No one wants to see a homeowner struggle. But if you’re a homeowner facing hardship, talk to your mortgage provider. You may have more options than you think.

Bottom Line

Recent headlines may not tell the whole story, but the data does. Foreclosure activity remains low by historical standards and is not a sign of another crash.

If you’re simply watching the market and want to understand what’s really going on, or how this impacts the value of your home, connect with an agent. They’ll help you separate fact from fear by showing you what the data really says.

David Demangos - eXp Realty
Cell: 858.232.8410 | Realtor® DRE# 01905183
www.AwesomeSanDiegoRealEstate.com
We Go to Extremes to Fulfill Real Estate Dreams
Monday, July 14, 2025

The Truth About Where Home Prices Are Heading


There are plenty of headlines these days calling for a housing market crash. But the truth is, they’re not telling the full story. Here’s what’s actually happening, and what the experts project for home prices over the next 5 years. And spoiler alert – it’s not a crash.

Yes, in some local markets, prices are flattening or even dipping slightly this year as more homes hit the market. That’s normal with rising inventory. But the bigger picture is what really matters, and it’s far less dramatic than what the doom-and-gloom headlines suggest. Here’s why.

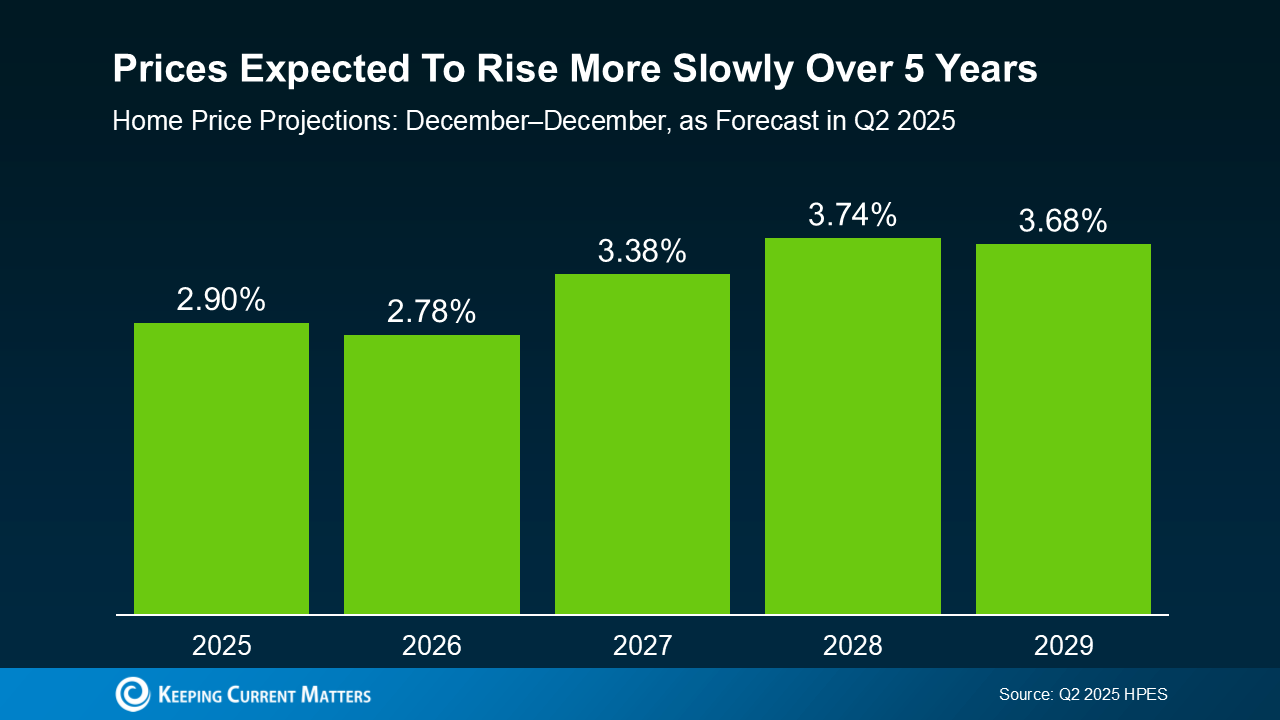
Over 100 leading housing market experts were surveyed in the latest Home Price Expectations Survey (HPES) from Fannie Mae. Their collective forecast shows prices are projected to keep rising over the next 5 years, just at a slower, healthier pace than what we’ve seen more recently. And that kind of steady, sustainable growth should be one factor to help ease your fears about the years ahead (see graph below):

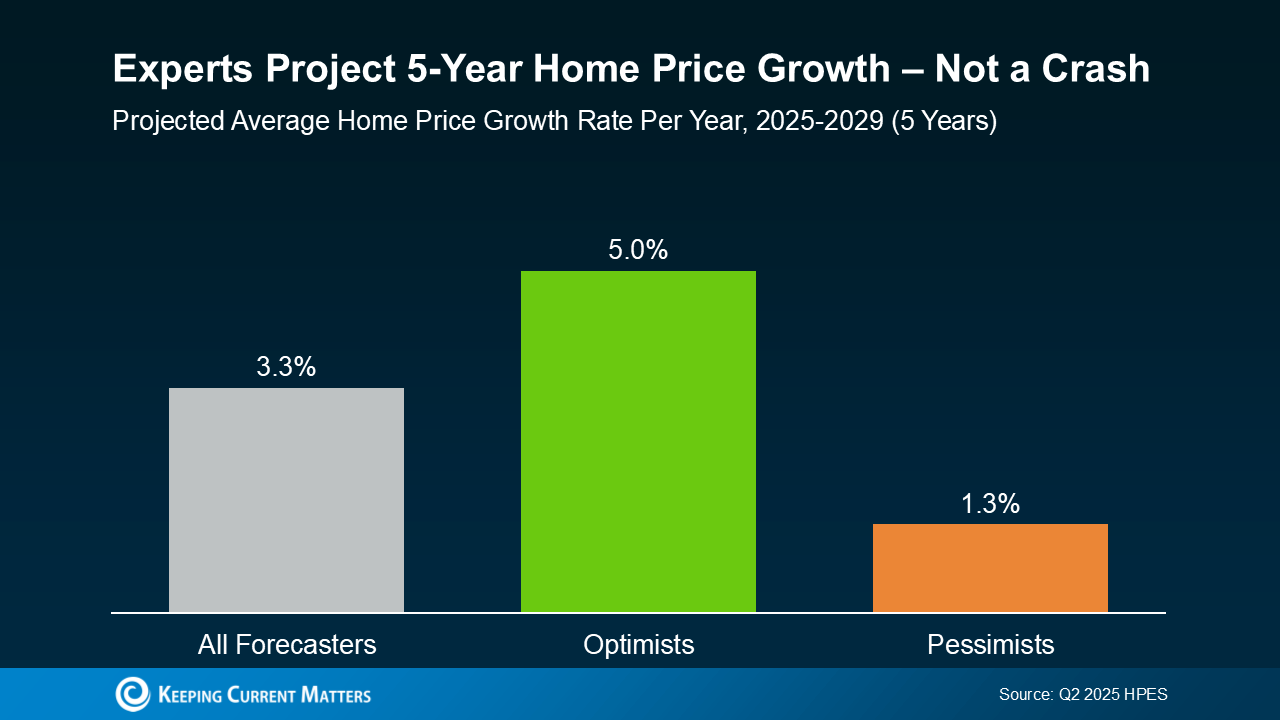
a graph with green barsAnd if you take a look at how the various experts responded within the survey, they fall into three main categories: those that were most optimistic about the forecast, most pessimistic, and the overall average outlook.

Here’s what the breakdown shows:

  • The average projection is about 3.3% price growth per year, through 2029.
  • The optimists see growth closer to 5.0% per year.
  • The pessimists still forecast about 1.3% growth per year.

Do they all agree on the same number? Of course not. But here’s the key takeaway: not one expert group is calling for a major national decline or a crash. Instead, they expect home prices to rise at a steady, more sustainable pace.

That’s much healthier for the market – and for you. Yes, some areas may see prices hold relatively flat or dip a bit in the short term, especially where inventory is on the rise. Others may appreciate faster than the national average because there are still fewer homes for sale than there are buyers trying to purchase them. But overall, more moderate price growth is cooling the rapid spikes we saw during the frenzy of the past few years.

And remember, even the most conservative experts still project prices will rise over the course of the next 5 years. That’s also because foreclosures are low, lending standards are in check, and homeowners have near record equity to boost the stability of the market. Together, those factors help prevent a wave of forced sales, like the kind that could drag prices down. So, if you’re waiting for a significant crash before you buy, you might be waiting quite a long time.

Bottom Line

If you’ve been on the fence about your plans, now’s the time to get clarity. The market isn’t heading for a crash – it’s on track for steady, slow, long-term growth overall, with some regional ups and downs along the way.

Want to know what that means for your neighborhood? Because national trends set the tone, but what really matters is what’s happening in your zip code. Connect with a real estate agent to have a quick conversation so you can see exactly what the local data means for you.


David Demangos - eXp Realty
Cell: 858.232.8410 | Realtor® DRE# 01905183
www.AwesomeSanDiegoRealEstate.com
We Go to Extremes to Fulfill Real Estate Dreams
Monday, June 16, 2025

Is Inventory Getting Back To Normal?

After years of it feeling almost impossible to find a home you want to buy, things are changing for the better.

Nationally, inventory is growing, and that gives you more options for your move. But here’s what you need to know. That level of growth is going to vary based on where you live. And that’s why you need an agent’s local market expertise.

Here’s a quick rundown of the current inventory situation, so you know what’s happening and what to expect.

Significant Growth Across the Nation

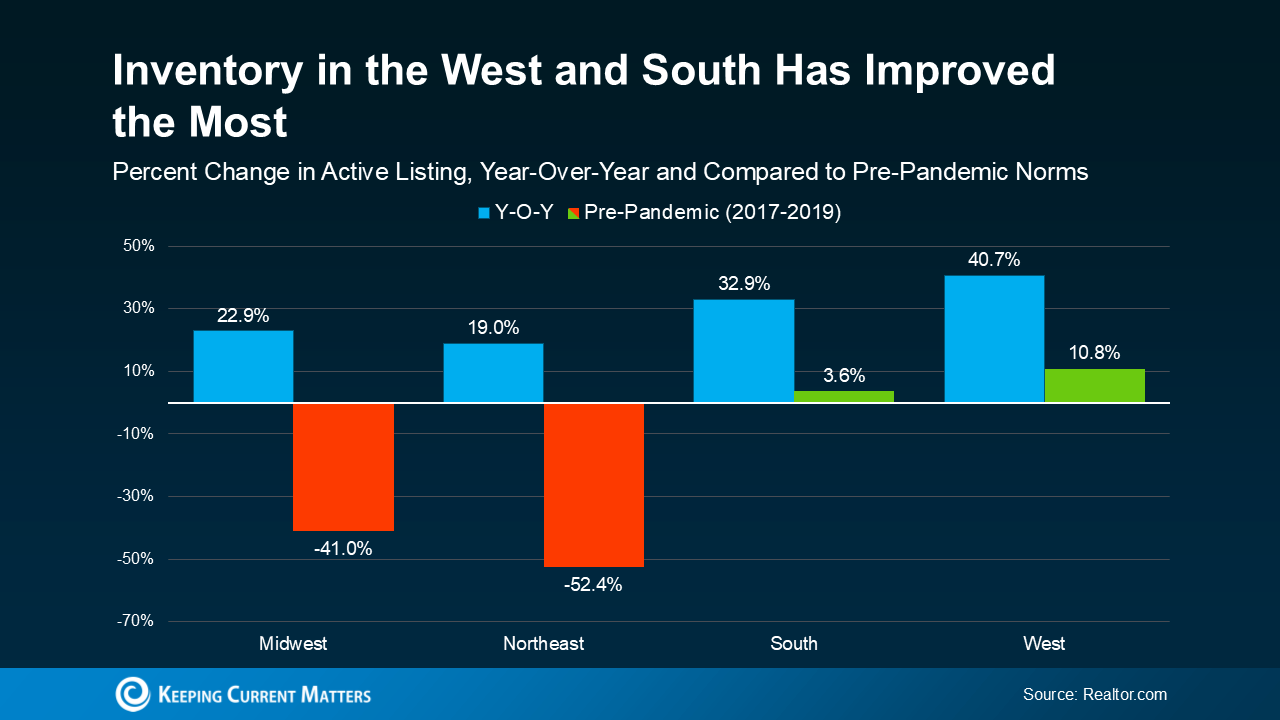
Nationally, the number of homes for sale is rising – and that’s true in all regions of the country. That’s shown in this data from Realtor.com. In each of the four regions, inventory is up at least 19% compared to the same time last year. In the West, it’s actually up almost 41% year-over-year (see graph below):

a graph with blue squaresThere are two main reasons for this increase:

  • More sellers are listing their homes. Many homeowners have been waiting for mortgage rates to drop before making a move. Now, some have decided they can’t wait any longer. May had more new listings than any May in the past three years.
  • Homes are taking longer to sell. That means listings are staying on the market longer, which increases the total number of homes available. In May, the typical home took 51 days to sell – much closer to what’s more typical for the market.

More homes for sale helps the market become more balanced. For the past few years, sellers have had the upper hand. Now, things are shifting. Nationally, it’s not a full-on buyer’s market yet, but it’s heading toward a healthier place, especially for homebuyers. Danielle Hale, Chief Economist at Realtor.comexplains:

“The number of homes for sale is rising in many markets, giving shoppers more choices than they’ve had in years . . . the market is starting to rebalance.

How Much Growth We’ve Seen Varies by Area

But, how long it’s going to take to achieve true balance is going to vary by area. Some parts of the country are seeing inventory bounce all the way back to normal levels, while others haven’t grown quite that much yet.

Let’s take a look at another graph. This time, we’ll compare the current data (what you already saw) to the last normal years in the housing market (2017-2019).

In this comparison, the green shows which regions are back at more typical levels for inventory based on the growth we’ve seen lately. The red shows where things have improved, but are still well below the norm (see graph below):

a graph of a graph with blue and orange squaresHere’s what that means for you. Across the board, you have more options now than you would’ve just one year ago. And that’s a really good thing. More choices means it should be a bit easier to find a home you love.

But not all markets are the same – some will take a bit longer to get back to more typical levels. So, lean on a local agent to find out what the inventory situation looks like where you want to live. They’ll be able to tell you how much growth they’ve seen locally and how to tailor your home search based on what’s available in that area. This is just one of the reasons a local agent’s perspective matters. 

Bottom Line

Inventory is getting better, but how long it takes to get back to normal is going to be different based on where you’re looking to buy. Talk with a local real estate agent about what’s happening in your local market and how it affects your next move.

David Demangos - eXp Realty
Cell: 858.232.8410 | Realtor® DRE# 01905183
www.AwesomeSanDiegoRealEstate.com
We Go to Extremes to Fulfill Real Estate Dreams

Monday, June 9, 2025

Understanding Today’s Mortgage Rates: Is 3% Coming Back?

A lot of buyers are pressing pause on their plans these days, holding out hope that mortgage rates will come down – maybe even back to the historic-low 3% from a few years ago. But here’s the thing: those rates were never meant to last. They were a short-term response to a very specific moment in time. And as the market finds its footing again, it’s time to reset expectations.

Back in 2020 and 2021, 3% mortgage rates gave buyers a serious boost: more affordability, more buying power, and more opportunity. But those rates were a result of emergency economic policies during the height of a global pandemic. Now that the economy is in a different place, we’re seeing mortgage rates in the high 6% to low 7% range.

And while experts currently project a slight easing in the months ahead, most industry leaders agree: rates are not going back to 3%.

Instead, many forecasts suggest mortgage rates will settle in the mid-6% range by the end of the year, pending any major economic shifts. As Kara Ng, Senior Economist at Zillow, says:

“While Zillow expects mortgage rates to end the year near mid-6%, barring any unforeseen shocks, that path might be bumpy.”

What Buyers Should Know

Basically, waiting for 3% rates might mean waiting longer than you’d expect – and missing out along the way. Instead of putting off homebuying indefinitely, make a plan to get there and focus on what you can control: your budget, your credit, and working with a trusted professional who can explain exactly what’s happening in the current market – and how to navigate it.

Your local real estate agent and a trusted lender make all the difference in this process. The experts have insights into down payment assistance programs, alternative financing options, negotiation strategies, and overall – the experience you need on your side to understand creative ways that will make your plans work.

And here’s the biggest thing to keep in mind. Since rates are projected to ease slightly later this year, if that happens, it could bring some more buyers back into the market. Acting now gives you a head start, especially with more homes on the market than we’ve seen in years.

Think about it: if mortgage rates do come down, what do you think everyone else is going to do? That’s right – they’ll jump back in too.

Getting ahead of that rush could put you in a stronger position to find the right home with less competition. Realtor.com sums it up well:

“Staying out of the market in hopes of a rate drop that never comes can lead to missed opportunities . . . Rising home prices, rent increases, and inflation might outpace any future savings on interest. And if rates do fall sharply again, buyers could face an entirely different challenge: surging competition.”

Bottom Line

Those 3% rates everyone remembers from a few years ago were the exception, not the rule.

Now that they’re settling into new territory, it’s a good time to adjust your expectations and learn more about where things are heading as this market shifts.

A local real estate agent and a trusted lender will be your best resources, always keeping you up-to-date and informed, so you can make sense of your options and build a game plan that works for you. 

David Demangos - eXp Realty
Cell: 858.232.8410 | Realtor® DRE# 01905183
www.AwesomeSanDiegoRealEstate.com
We Go to Extremes to Fulfill Real Estate Dreams
Saturday, May 17, 2025

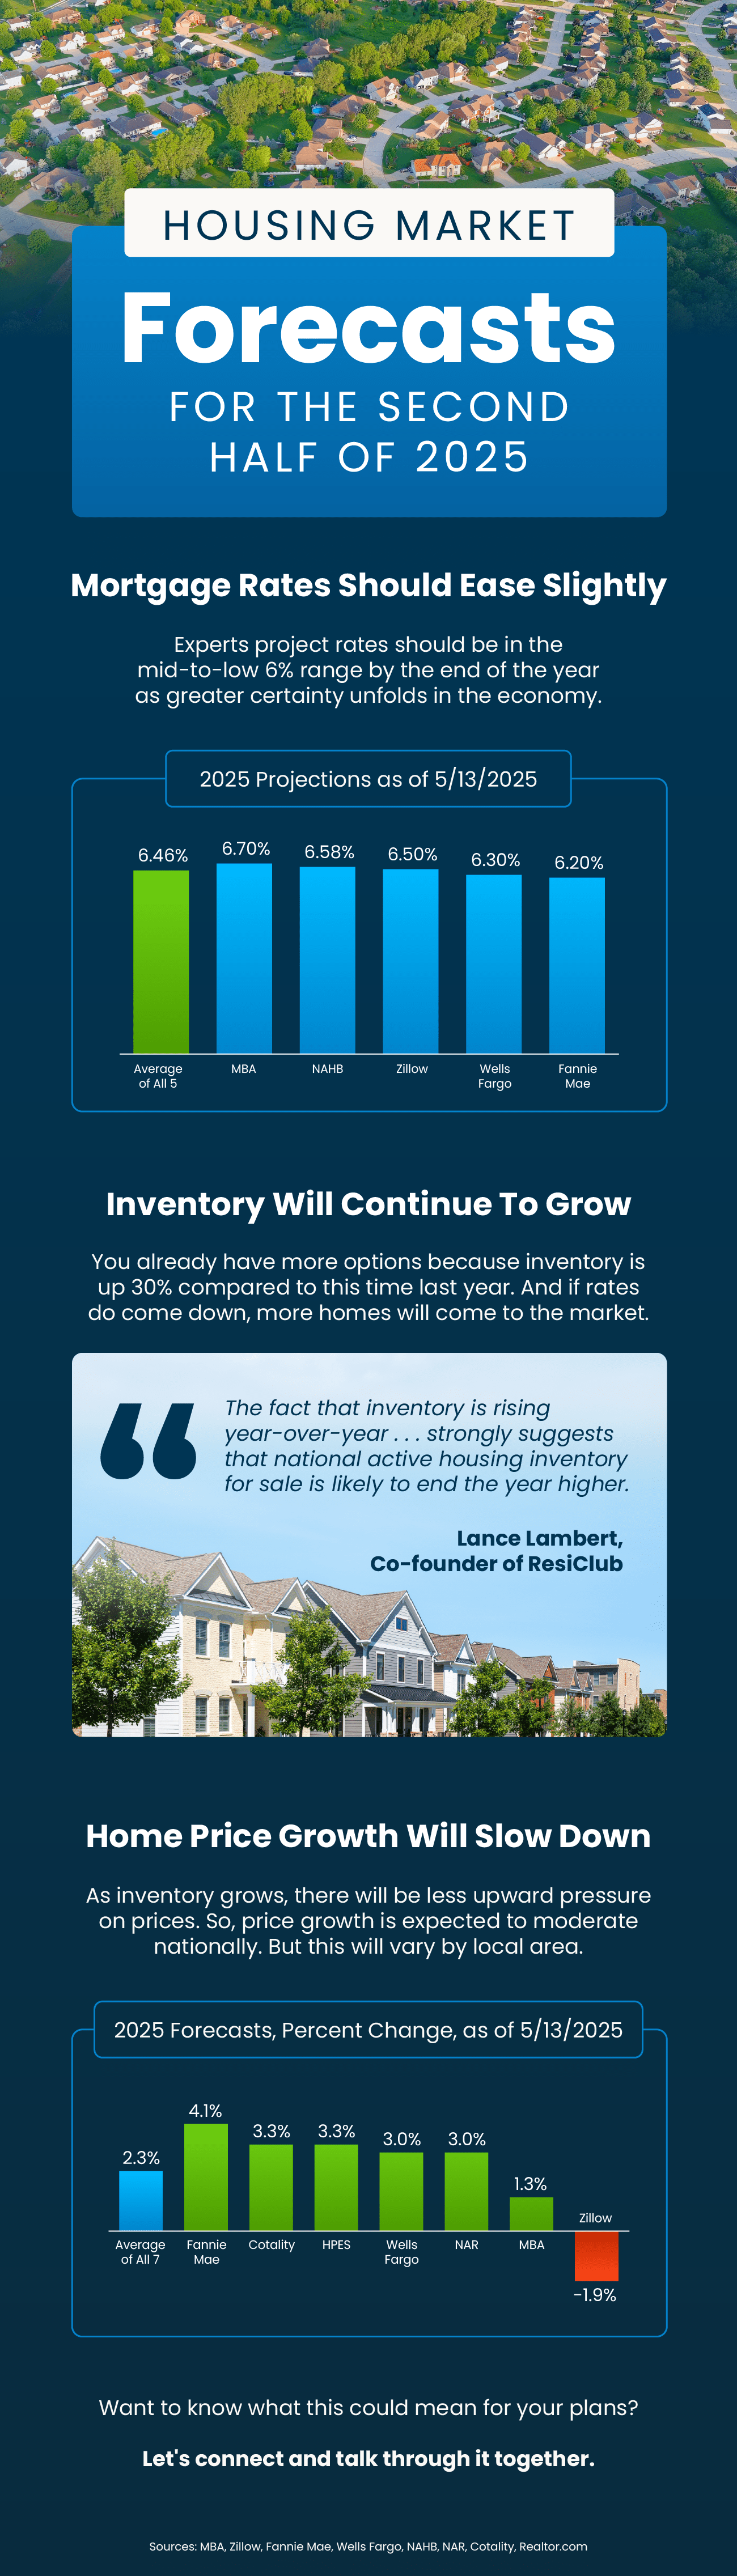
Housing Market Forecasts for the Second Half of 2025

a screenshot of a mobile app

Some Highlights

• Are you wondering what to expect if you buy or sell a home in the second half of the year? Here’s what the expert forecasts tell you.

• Mortgage rates are expected to come down slightly. There will be more homes available for sale. And as inventory rises, home price growth will moderate.

• Want to know what this could mean for your plans? Let's connect and talk through it together.


David Demangos - eXp Realty
Cell: 858.232.8410 | Realtor® DRE# 01905183
www.AwesomeSanDiegoRealEstate.com
We Go to Extremes to Fulfill Real Estate Dreams

Monday, May 5, 2025

What an Economic Slowdown Could Mean for the Housing Market

Talk about the economy is all over the news, and the odds of a recession are rising this year. That’s leaving a lot of people wondering what it means for the value of their home – and their buying power.

Let’s take a look at some historical data to show what’s happened in the housing market during each recession, going all the way back to the 1980s. The facts may surprise you.

A Recession Doesn’t Mean Home Prices Will Fall

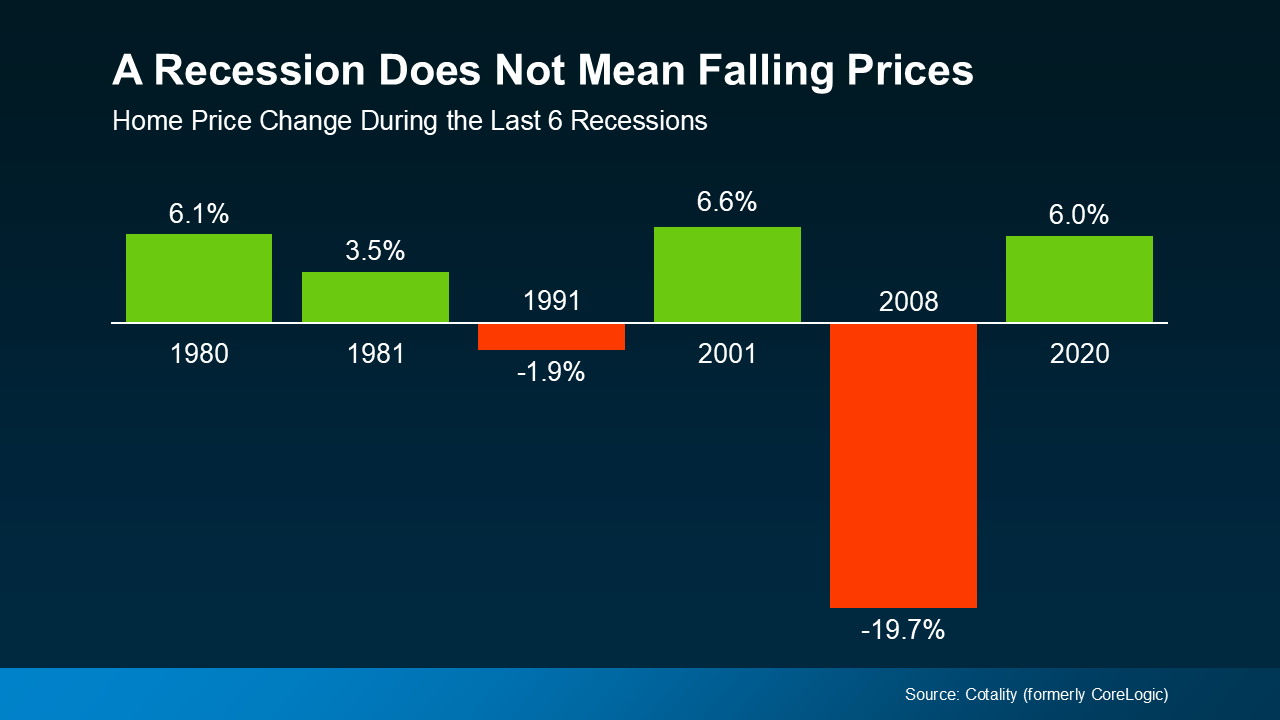
Many people think that if a recession hits, home prices will fall like they did in 2008. But that was an exception, not the rule. It was the only time the market saw such a steep drop in prices. And it hasn’t happened since, mainly because inventory is still so low overall. Even in markets where the number of homes for sale has started to rise this year, inventory is still far below the oversupply of homes that led up to the housing crash.

In fact, according to data from Cotality (formerly CoreLogic), in four of the last six recessions, home prices actually went up (see graph below):

a graph of a graph showing the price of falling pricesSo, don’t assume a recession will lead to a significant drop in home values. The data simply doesn’t support that idea. Instead, home prices usually follow whatever trajectory they’re already on. And right now, nationally, home prices are still rising, just at a more normal pace.

Mortgage Rates Typically Decline During Recessions

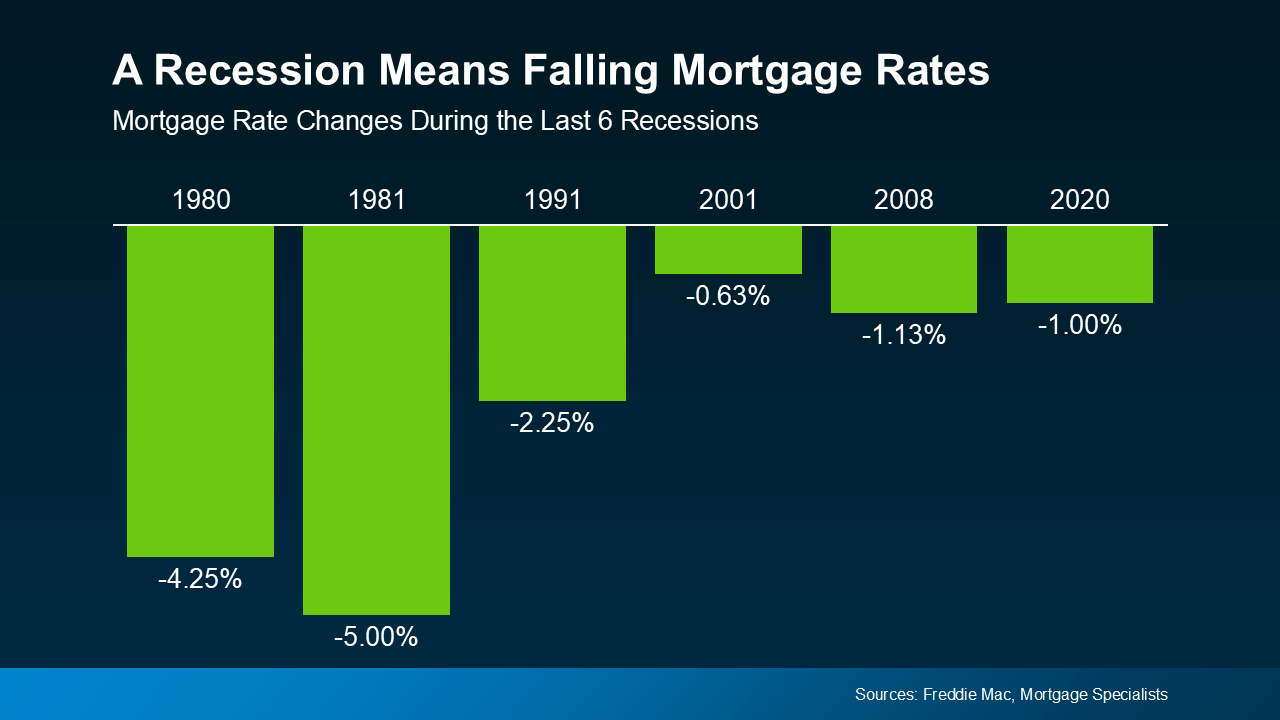
While home prices tend to stay on their current path, mortgage rates usually drop during economic slowdowns. Again, looking at data from the last six recessions, mortgage rates fell each time (see graph below):

a graph of a graph showing the rise of mortgage ratesSo, a recession means rates could decline. And while that would help with your buying power, don’t expect the return of a 3% rate.

Bottom Line

The answer to the recession question is still unknown, but the odds have gone up. However, that doesn’t mean you have to worry about what it means for the housing market – or the value of your home. Historical data tells us what usually happens.

If you’re wondering how the current economy is impacting our local market, let’s connect.

David Demangos - eXp Realty
Cell: 858.232.8410 | Realtor® DRE# 01905183
www.AwesomeSanDiegoRealEstate.com
We Go to Extremes to Fulfill Real Estate Dreams