
What Does This Mean for Homeowners?
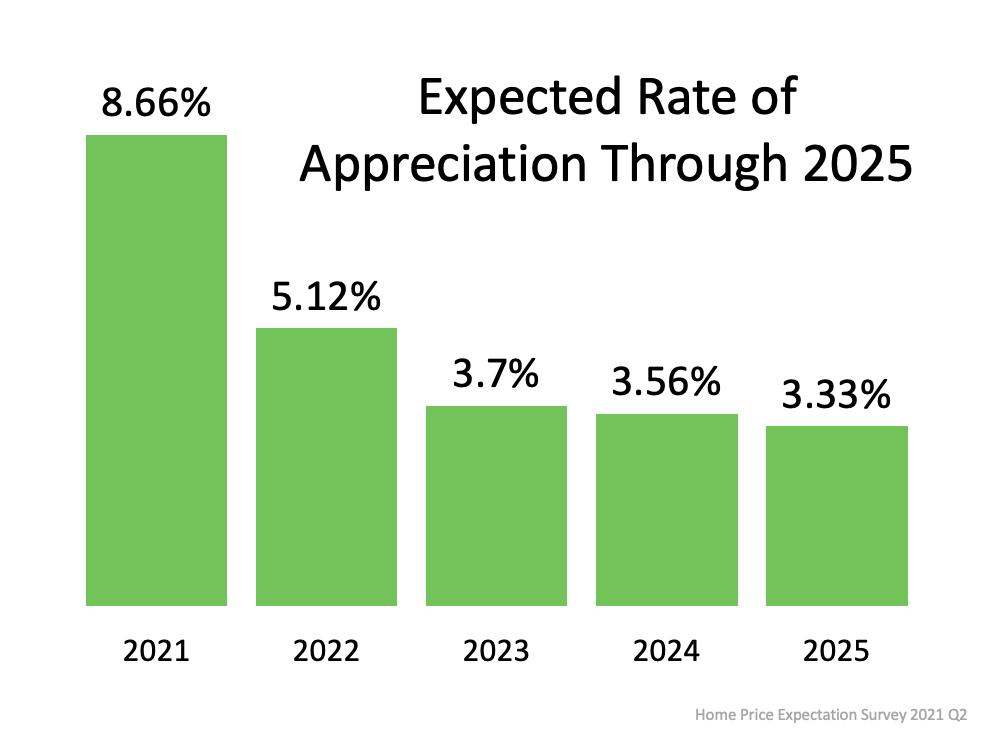
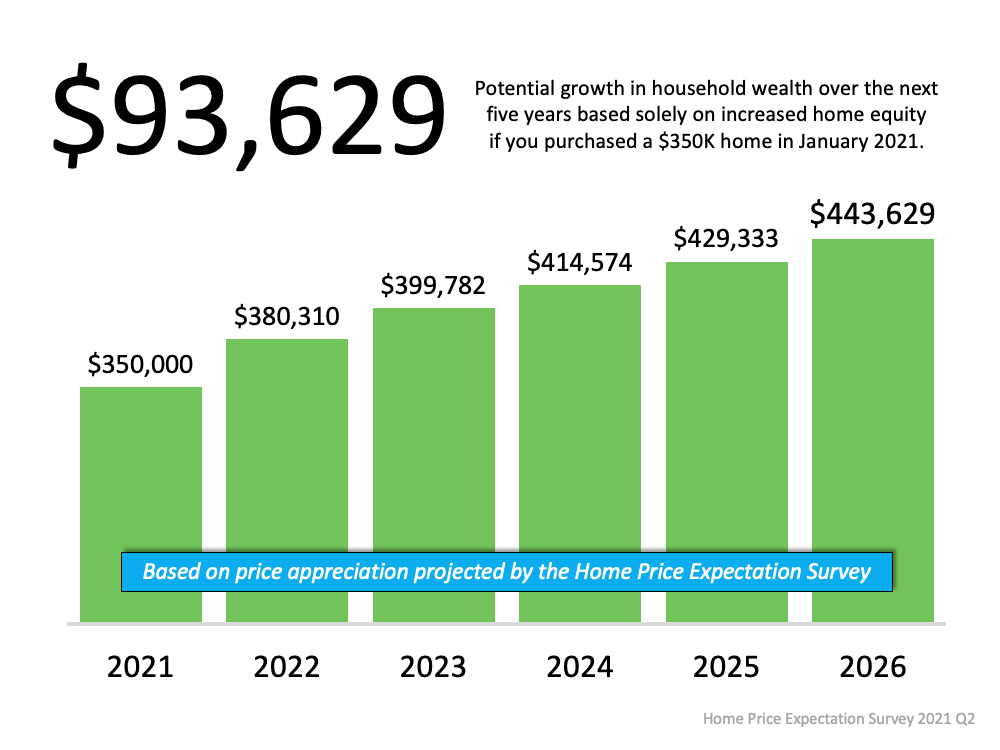
Home prices are climbing today, and the data in the survey indicates they’ll continue to increase, but at rates that approach a more normal pace. Even still, the amount of household wealth a homeowner stands to earn going forward is substantial. This truly becomes clear when we consider a scenario using a median-priced home purchased in January of 2021 and the projected rate of appreciation on that home over the next five years. As the graph below illustrates, a homeowner could increase their net worth by a significant amount – over $93,000 dollars by 2026
Home prices are climbing today, and the data in the survey indicates they’ll continue to increase, but at rates that approach a more normal pace. Even still, the amount of household wealth a homeowner stands to earn going forward is substantial. This truly becomes clear when we consider a scenario using a median-priced home purchased in January of 2021 and the projected rate of appreciation on that home over the next five years. As the graph below illustrates, a homeowner could increase their net worth by a significant amount – over $93,000 dollars by 2026
.
Home Price Appreciation and Home Equity
CoreLogic recently released their quarterly Homeowner Equity Insights Report, which tracks the year-over-year increases in equity. It shows an average annual gain of $33,400 per borrower over the past 12 months. In the report, Dr. Frank Nothaft, Chief Economist for CoreLogic, further explains:
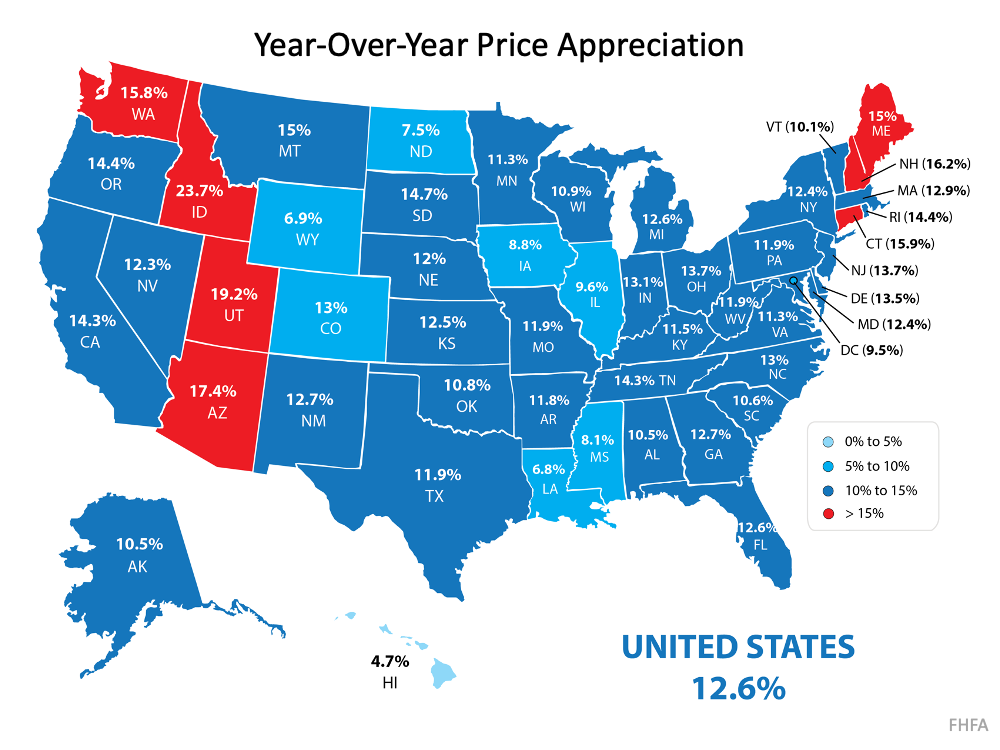
“Double-digit home price growth in the past year has bolstered home equity to a record amount. The national CoreLogic Home Price Index recorded an 11.4% rise in the year through March 2021, leading to a $216,000 increase in the average amount of equity held by homeowners with a mortgage.”
The expected, sustained growth of home prices means homeowners can continue to build on the past year’s record levels of home equity – and their financial prosperity. It also presents today’s homeowners with a unique opportunity: using their growing equity for a home upgrade. With so few homes available to purchase and strong buyer demand, there may not be a better time to sell your current house and move into one that better meets your needs.
Home Price Appreciation and Home Equity
CoreLogic recently released their quarterly Homeowner Equity Insights Report, which tracks the year-over-year increases in equity. It shows an average annual gain of $33,400 per borrower over the past 12 months. In the report, Dr. Frank Nothaft, Chief Economist for CoreLogic, further explains:
“Double-digit home price growth in the past year has bolstered home equity to a record amount. The national CoreLogic Home Price Index recorded an 11.4% rise in the year through March 2021, leading to a $216,000 increase in the average amount of equity held by homeowners with a mortgage.”
The expected, sustained growth of home prices means homeowners can continue to build on the past year’s record levels of home equity – and their financial prosperity. It also presents today’s homeowners with a unique opportunity: using their growing equity for a home upgrade. With so few homes available to purchase and strong buyer demand, there may not be a better time to sell your current house and move into one that better meets your needs.
Bottom Line
Home prices are expected to continue appreciating over the next five years, and the associated equity gains are the quickest way homeowners can build household wealth. If you’re a current homeowner who’s ready to take advantage of your built-up equity, let’s connect today to discuss your options.
Looking to Buy, Sell, or Invest? Contact:
David Demangos - eXp Realty
Cell: 858.232.8410 | Realtor® DRE# 01905183
www.AwesomeSanDiegoRealEstate.com
We Go to Extremes to Fulfill Real Estate Dreams!
San Diego Real Estate Expert | Global Property Specialist
Certified Luxury Marketing Specialist | CLHMS Million Dollar Guild Agent
Green Specialist | Certified International Property Specialist
2016, 2017, 2018,& 2019 Recognition of Excellence Award Winner SDAR